44% of all salespeople give up on trying to make a sale after only one rejection. This means that if you had a step by step process to walk your leads through, you could track the number of attempts that have been made.
Most sales are only made at the fifth attempt and this process will help you get there and take advantage of every lead.
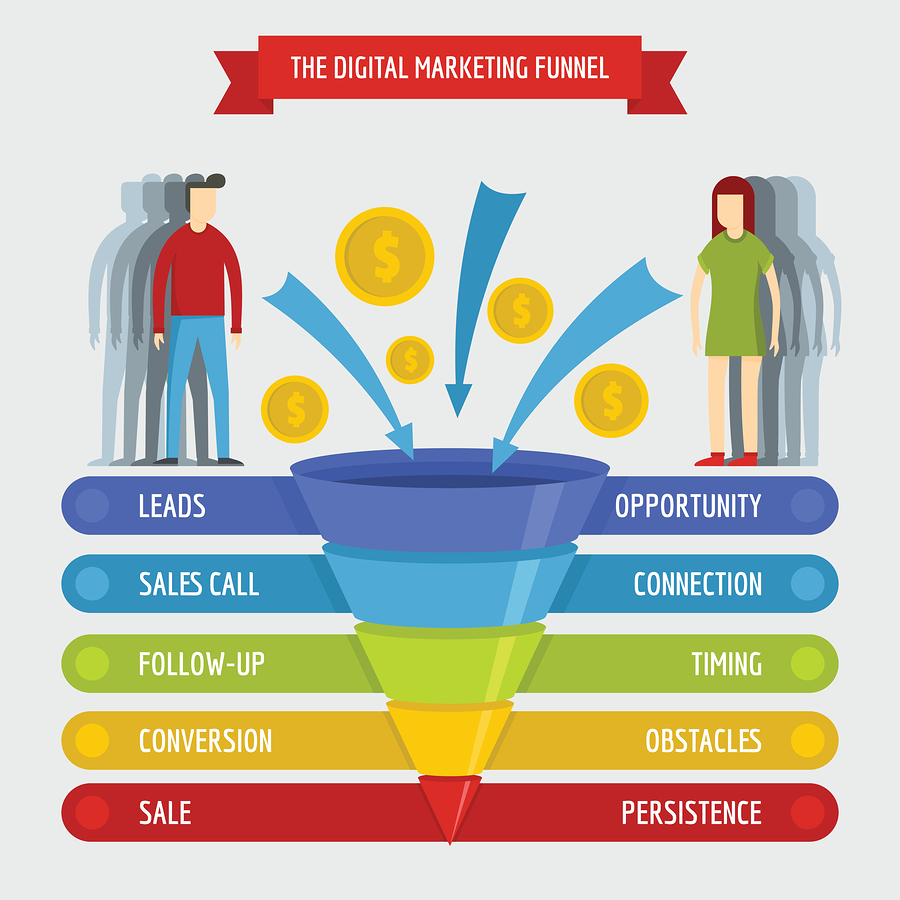
This is otherwise known as a sales funnel.
So, why should you be using a sales funnel?
Well, in short, it is because 96% of all the customers that visit your website are not ready to make a purchase from you yet. They simply do not trust you enough. This is not the end of the road though because while they may not be ready to make a purchase, they may be willing to give you their contact information in exchange for great content.
You can then foster a relationship with your potential lead and eventually bring that person to the point where they do trust you enough to buy your service or product. In order to increase your sales numbers, you can use a sales funnel builder that will guide and automate potential leads through the process of trusting you and then nurture them to make a purchase.
A good quote to keep in mind when you are creating this relationship is one by Dan Sullivan (Strategic Coach) – ”Before we buy a product, or a service, or an experience. The first thing we actually buy is a relationship.’
What Is A Sales Funnel?
A sales funnel is a marketing model that involves steps that a customer would have to take to make a purchase. As businesses have evolved and fine-tuned their marketing techniques, sales funnels have become increasingly popular among companies that know what they are doing.
Let us consider an example of a sales funnel for a cupcake shop.

Your customer will first walk by your shop which is the first step of the funnel.
The next step would be a certain number of people who may choose to walk in because they were tempted by the window display of cupcakes you have. Once they are inside, they will take a look at your menu and select a few items they want to buy.
Last step- They approach the counter, place the order, and make the payment.
It is important to note that each step in this funnel needs to be taken care of so that your customers convert. If any step in your sales funnel is not optimized, a potential buyer could leave the store / website before they finish their purchase.
You should also make sure you are constantly identifying and testing your funnel to convert the highest percentage of customers.
7 Proven Sales Funnel Examples That You Can Immediately Apply To Your Business
With over ten years of experience in digital marketing and sales, I have seen plenty of stores, websites, and companies come and go. A few stood out and succeeded and a big reason for that was because they optimized their marketing techniques- especially their sales funnels.
Here are 9 proven sales funnel examples that work like a charm-
#1 The ‘Russell Brunson’ Sales Funnel
Type of sales funnel: Free Book Funnel
Russel Brunson asks customers for their address to send them a completely free item. The only thing customers pay for is shipping. Since an address is an extremely personal piece of information, the product needs to be tempting enough to convince a potential customer to sign up. This is why he is offering his potential leads a physical book rather than just an ebook. It has a higher value attached to it.
What does this sales funnel look like?
The customer is directed to the landing page through ads, referrals, social media traffic, etc. Once they enter their address, the sales funnel kicks off with an order bump (that will send the free book to the customer), a one time offer (OTO) for another one of his products, and some other upsells to his software Clickfunnels as well as his courses and even live events. Of course, this works with ClickFunnel alternatives as well.
Here you can see all of the steps of that sales funnel-
Why is this type of funnel used?
This sales funnel is used by companies that have multiple items to sell. They will start off with a very attractive offer (such as a free physical book) which will add a lot of people to their sales funnel because who doesn’t want a product valued at $20 for free?
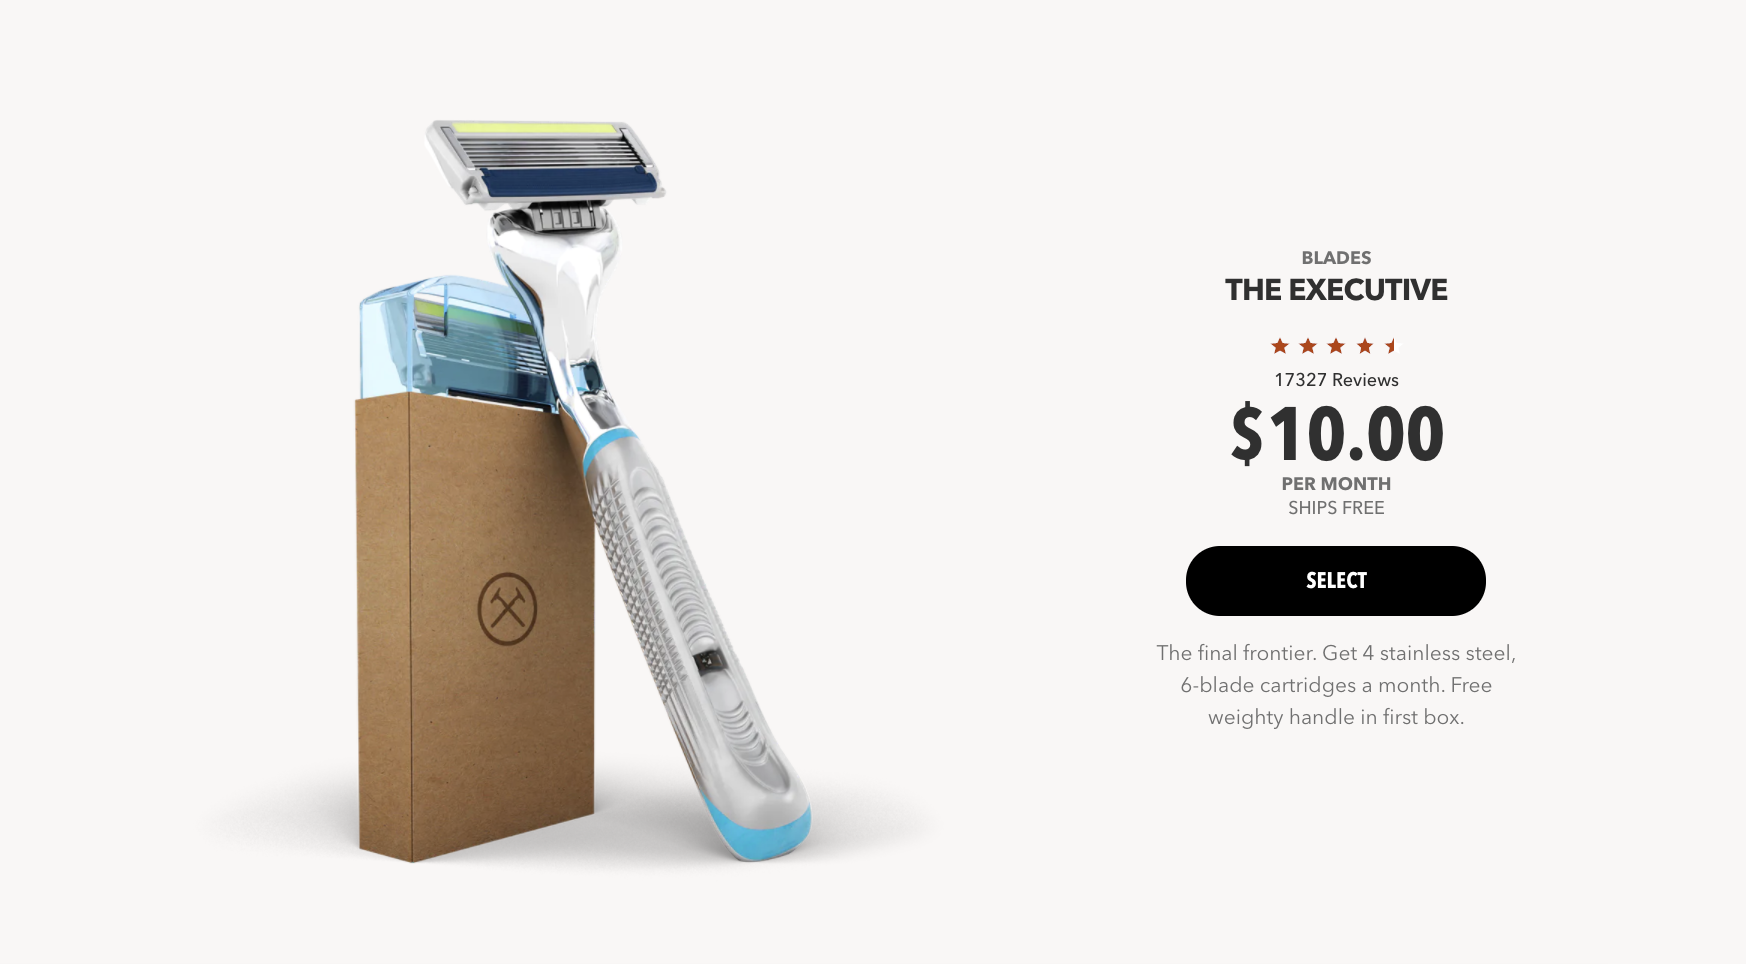
The goal is to add as many people as possible to their sales funnel so that they have a long list of customers to send their upsells to down the line. It is very similar to the Dollar Shave Club’s sales funnel, where you get 4 stainless steel, 6-blade cartridges a month for only $10.
(Source)
What makes it unique?
Before Russell started offering physical books in exchange for people’s addresses, every company was offering free ebooks in exchange for email addresses.
Since everybody was doing this, the offer itself wasn’t that attractive anymore. Russell decided to offer a physical version of it instead (something different + higher perceived value).
But the real uniqueness of it is that Russell gets unlimited customers for free with that funnel (Break Even Sales Funnel) and makes all his profits in the backend, selling his software, online coaching programs, masterminds and so on.
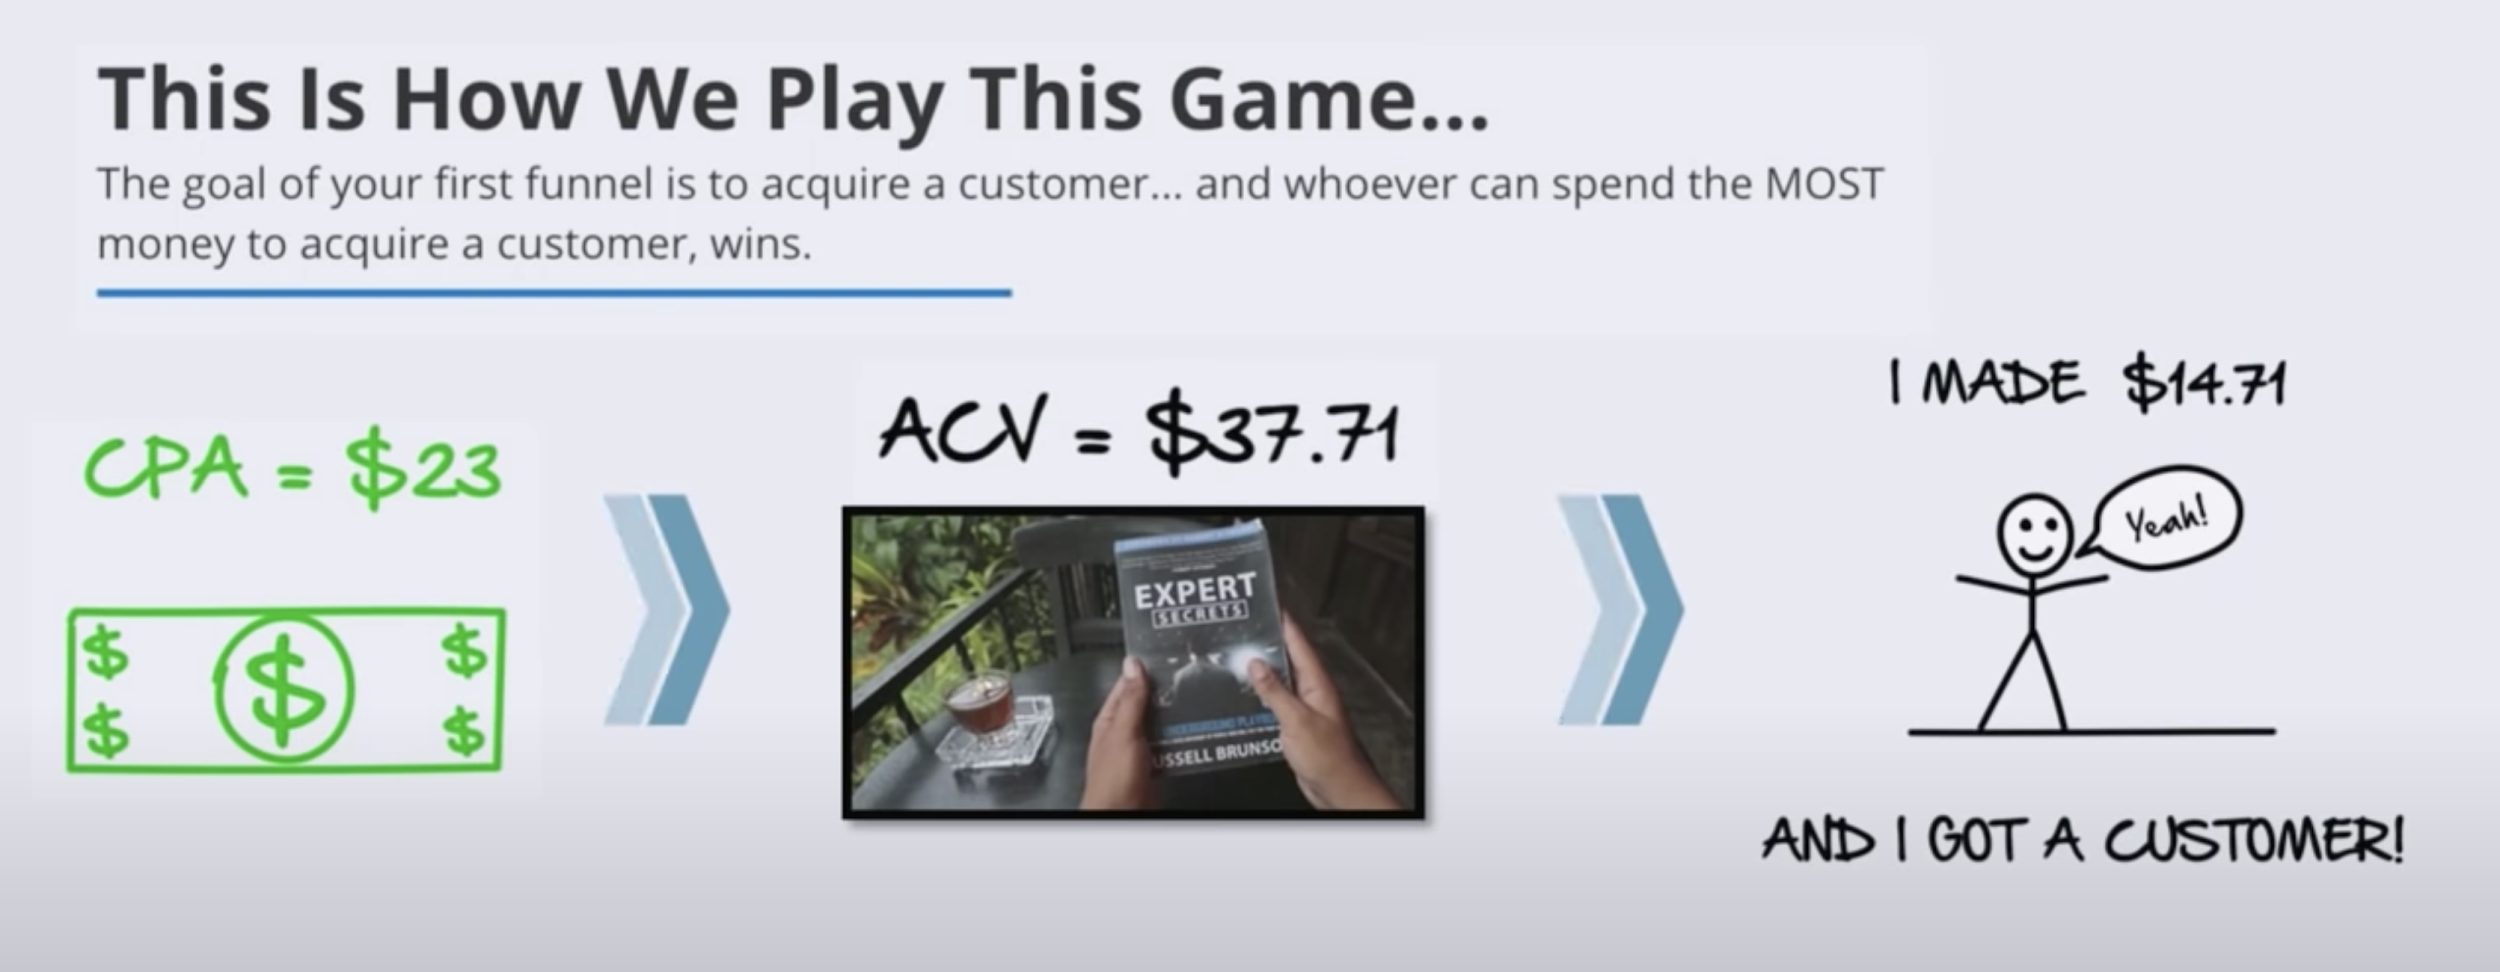
With this specific funnel, Russell spends $23 to sell one of his books (CPA = $23) and generates $37.71 per customer (ACV = $37,71) because of the order form bump as well as the other upsells. This means he makes $14,71 per customer but most importantly – he got a new customer (to whom he’ll sell all his backend products).
If you have not watched the video below of Russell’s ‘How to Profitably Acquire Unlimited Customers’, you should take a look at it after you finish reading this article.
It explains his strategy in detail and it is a really valuable piece of free content-
(Source)
His whole methodology is based on Dan Kennedy’s quote: “A business beats its competition by making the same prospect worth more to his business than to that of his competition.”
Or in other words: “Whoever can spend the most money to acquire a customer wins.”
#2 The ‘Consulting.com’ Sales Funnel
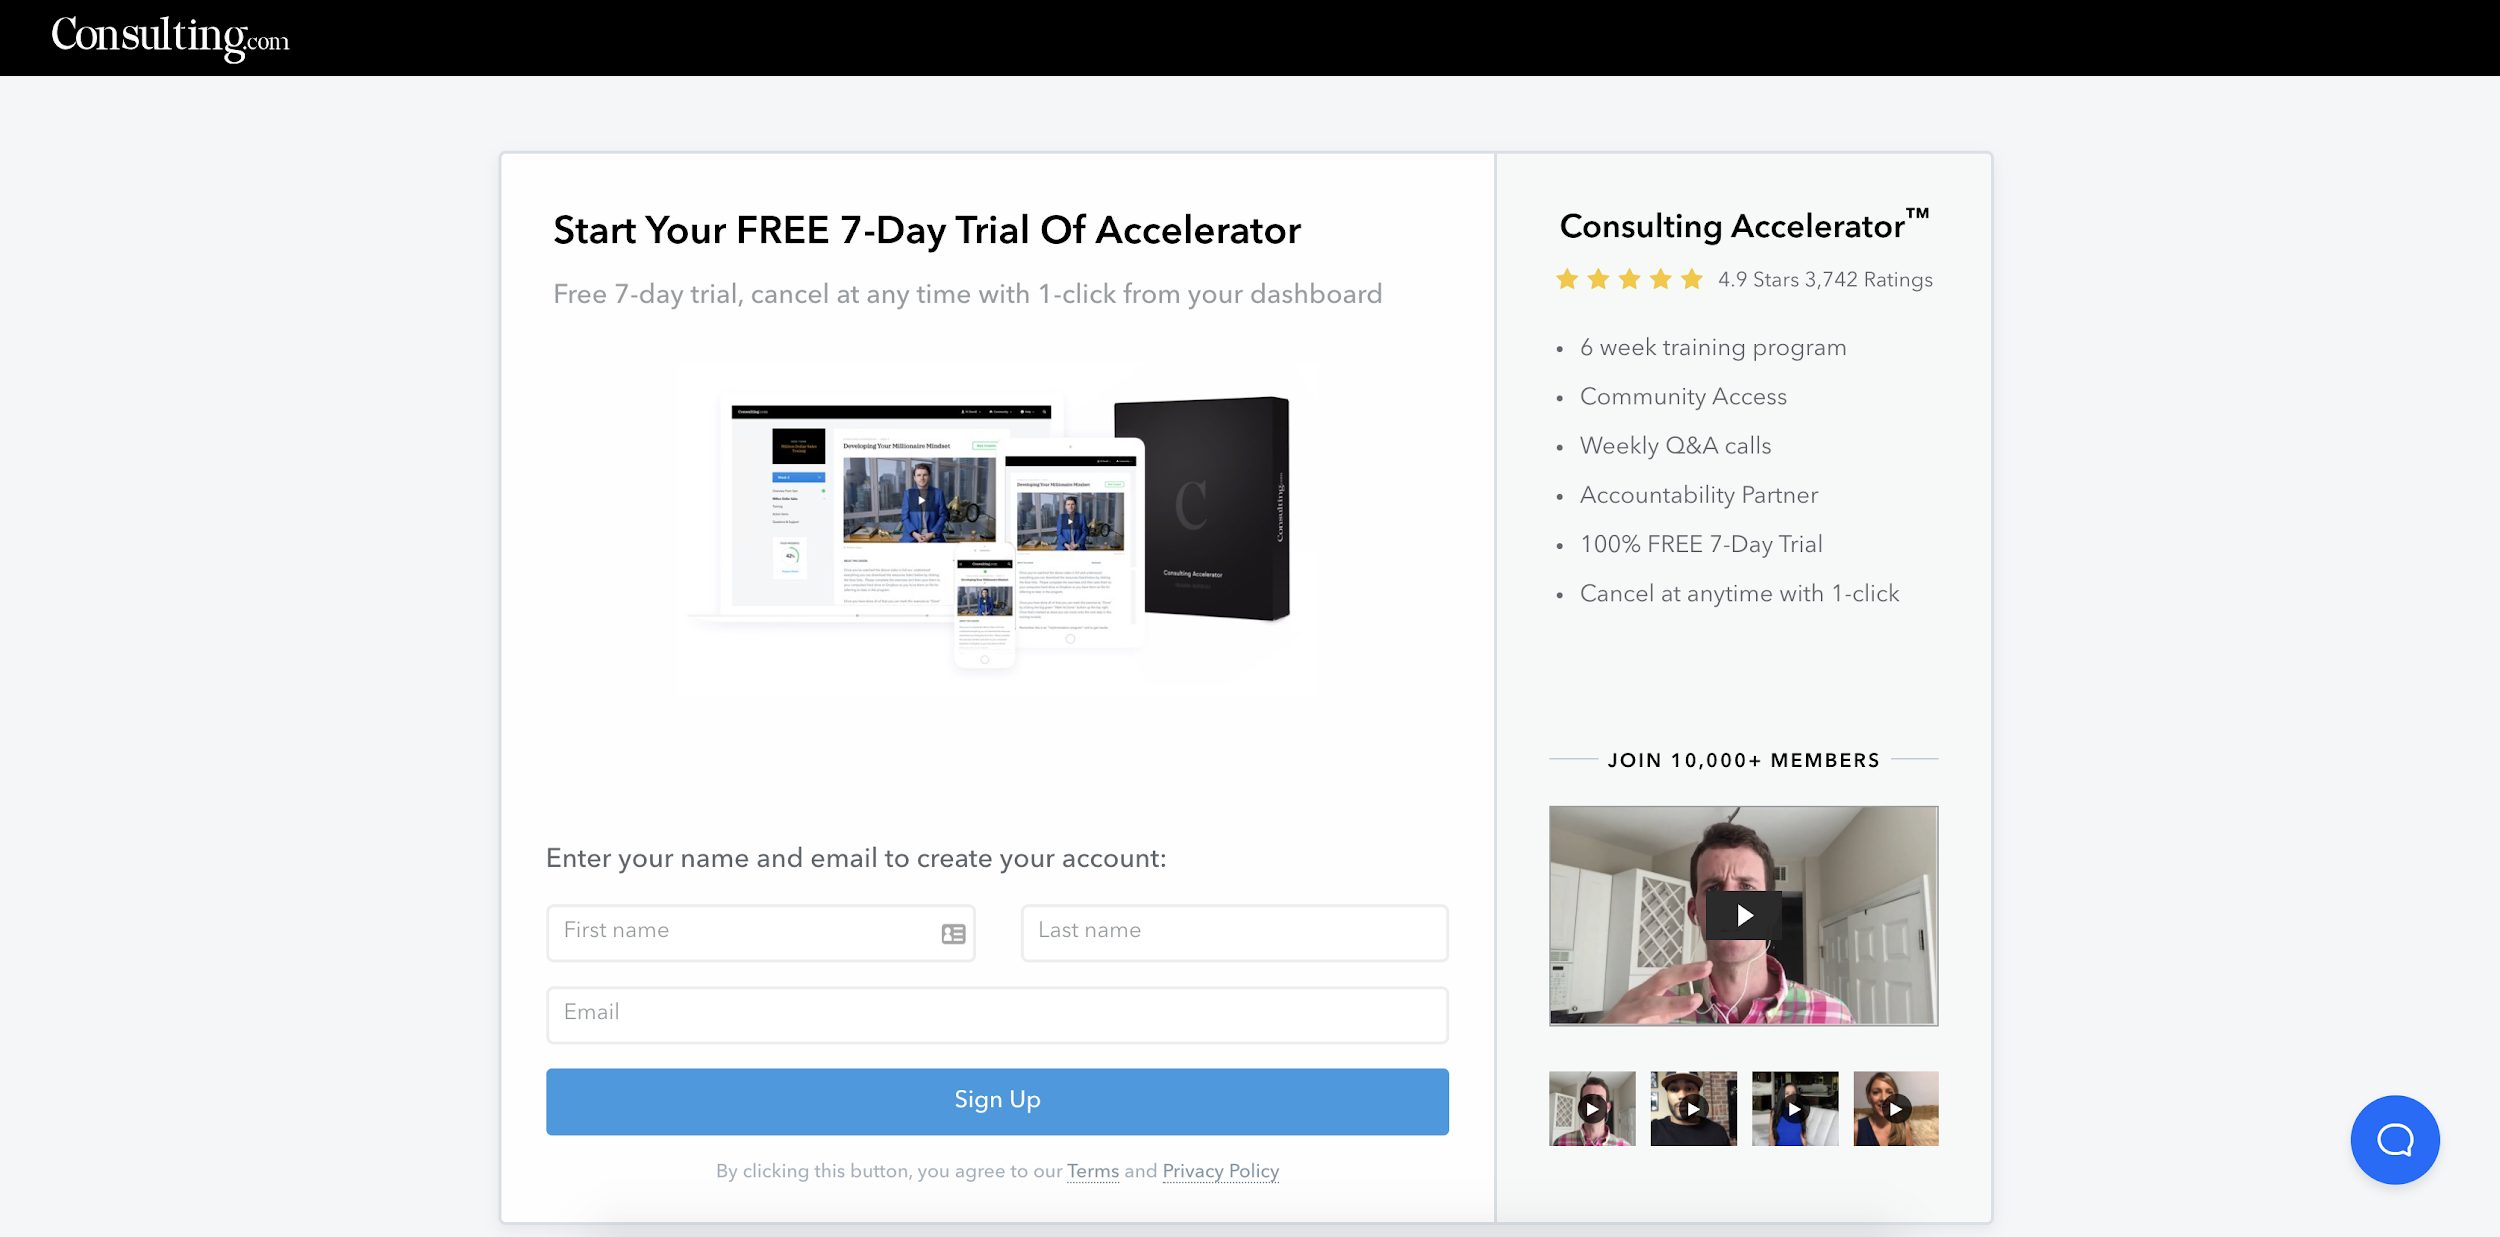
Type of sales funnel: ‘Free Trial’ Funnel
Consulting.com uses a free trial to sell their Consulting Accelerator program. It is normally offered by companies who are providing subscription-based services like SEO tools, best web hosting, membership sites, etc.
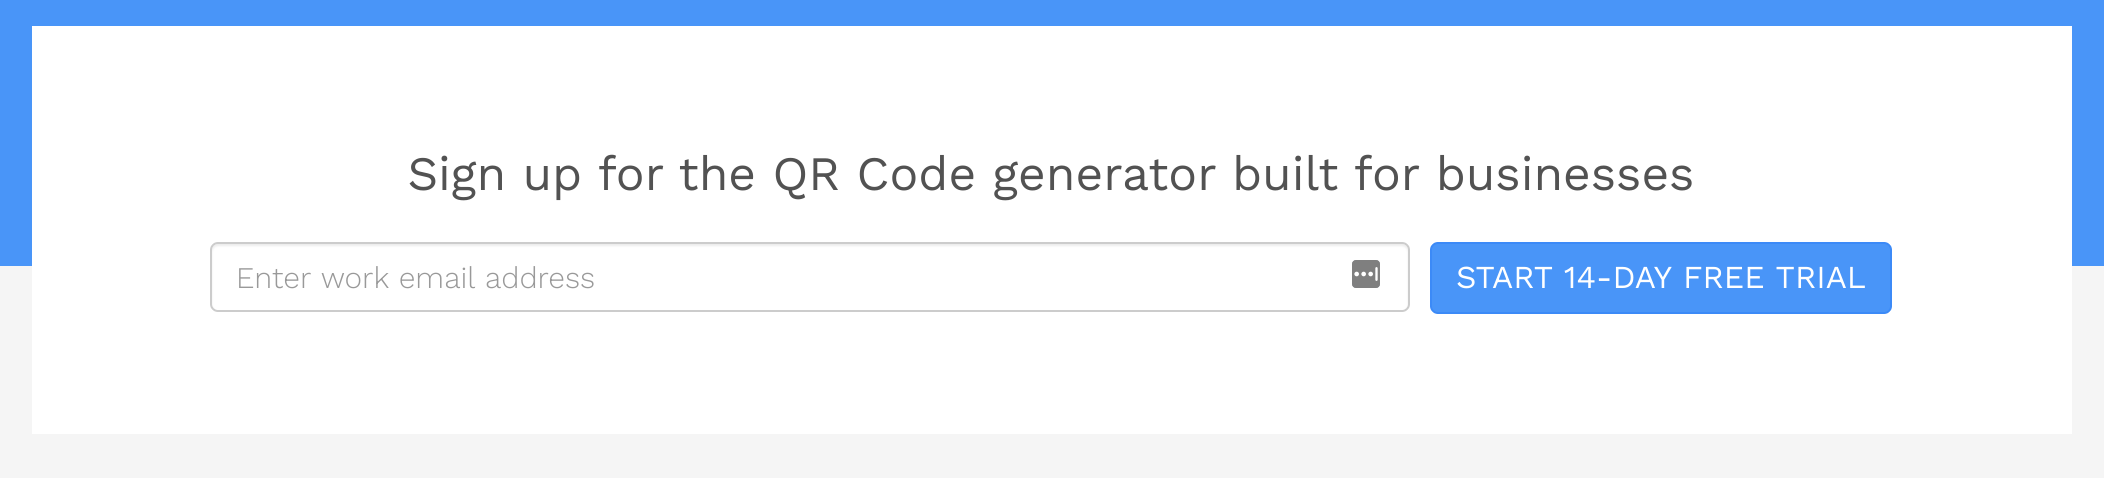
You can use all of their offered services for free for some time – mostly for 3, 7 or sometimes even 14 days . This is similar to the model used by Uniqode’s QR code generator.
What does this sales funnel look like?
Once you sign up for the free trial you’ll be asked to enter your credit card details. 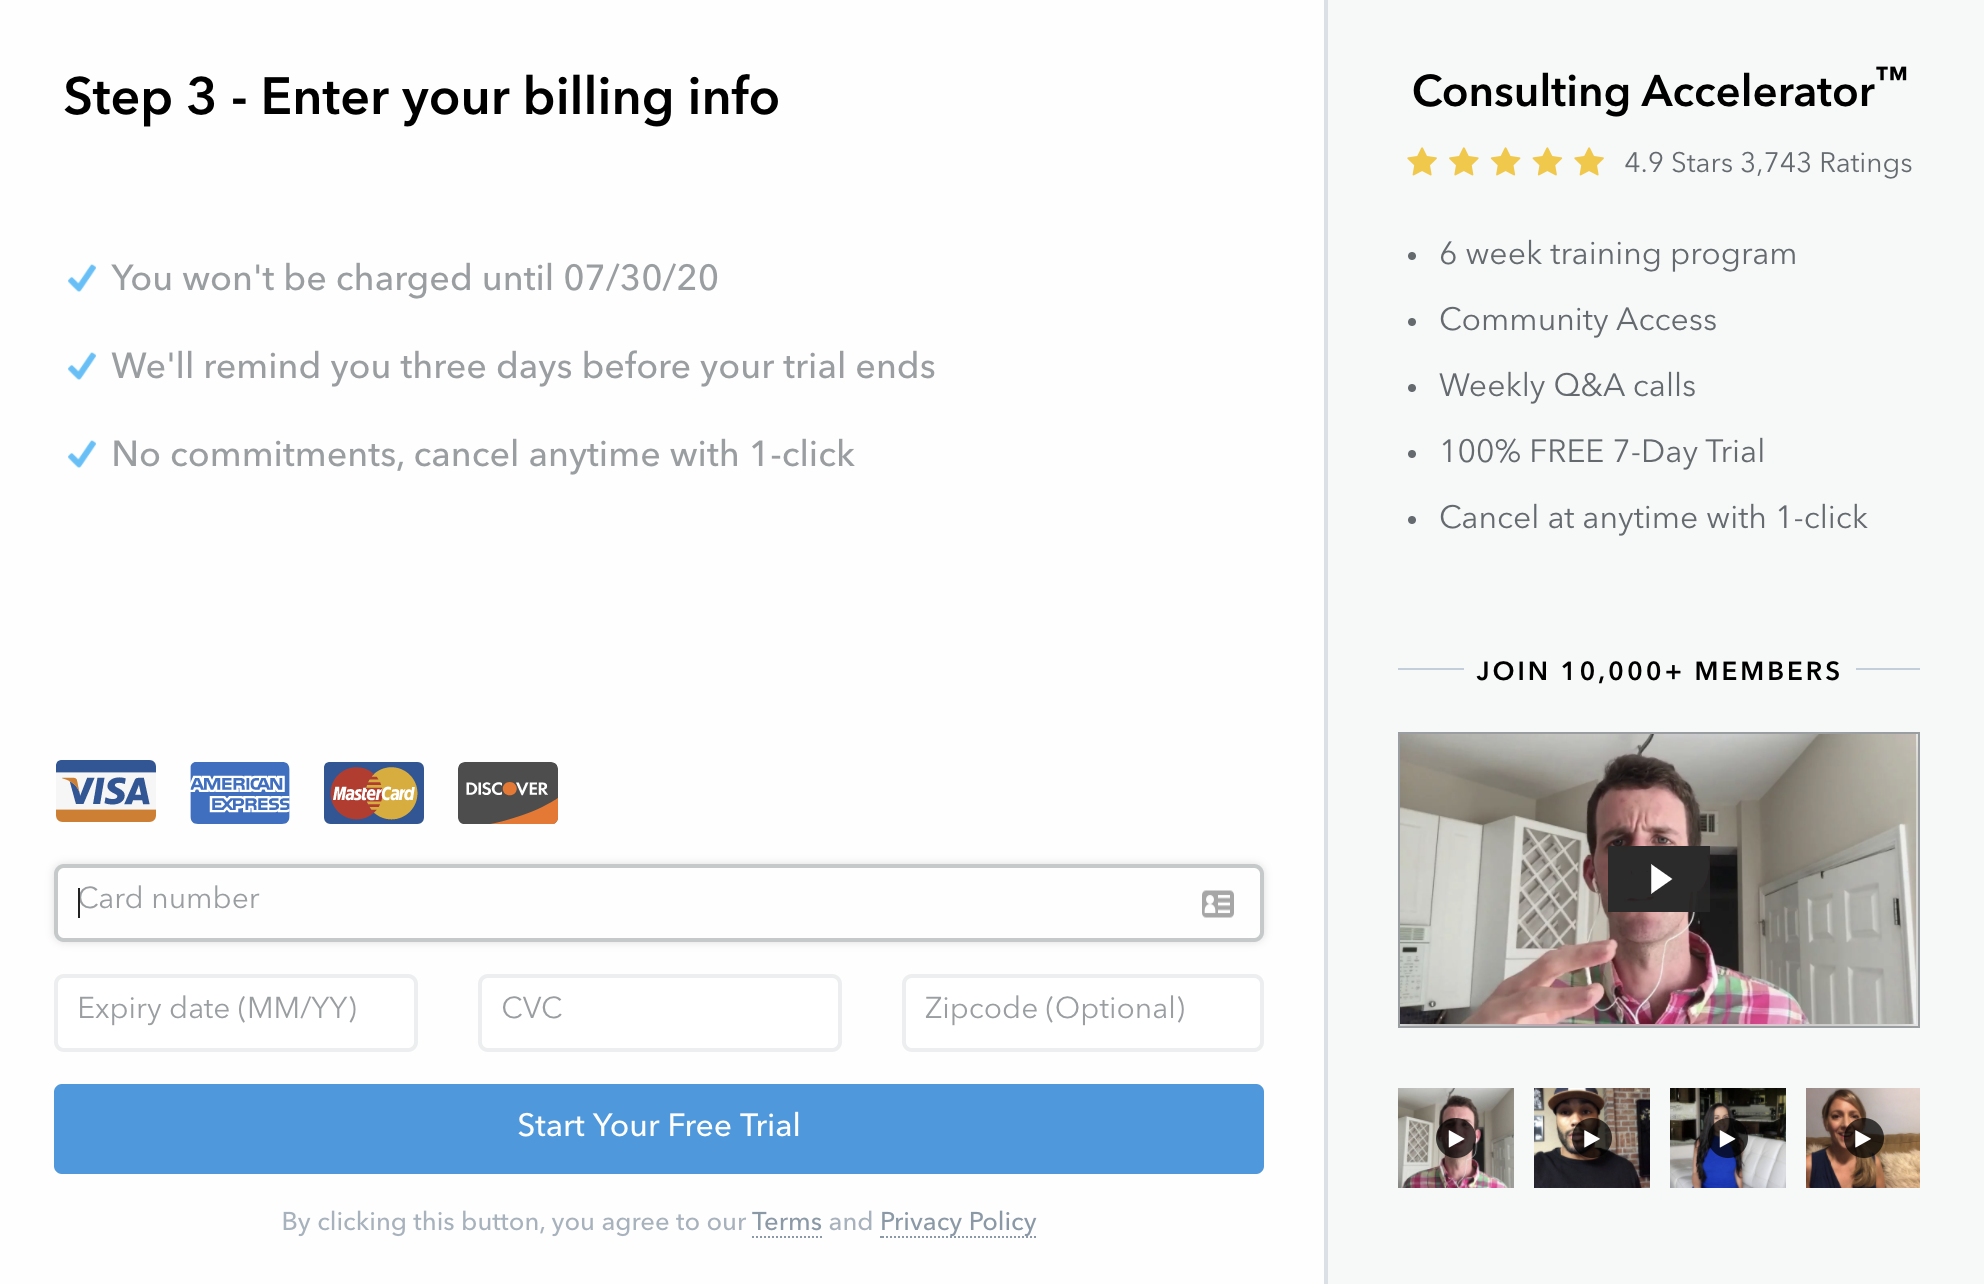
After that you will be asked a lot of questions about your business and how you operate. Questions about how many employees you have, income level, etc.
This is a great way for them to gather valuable information about their audience.
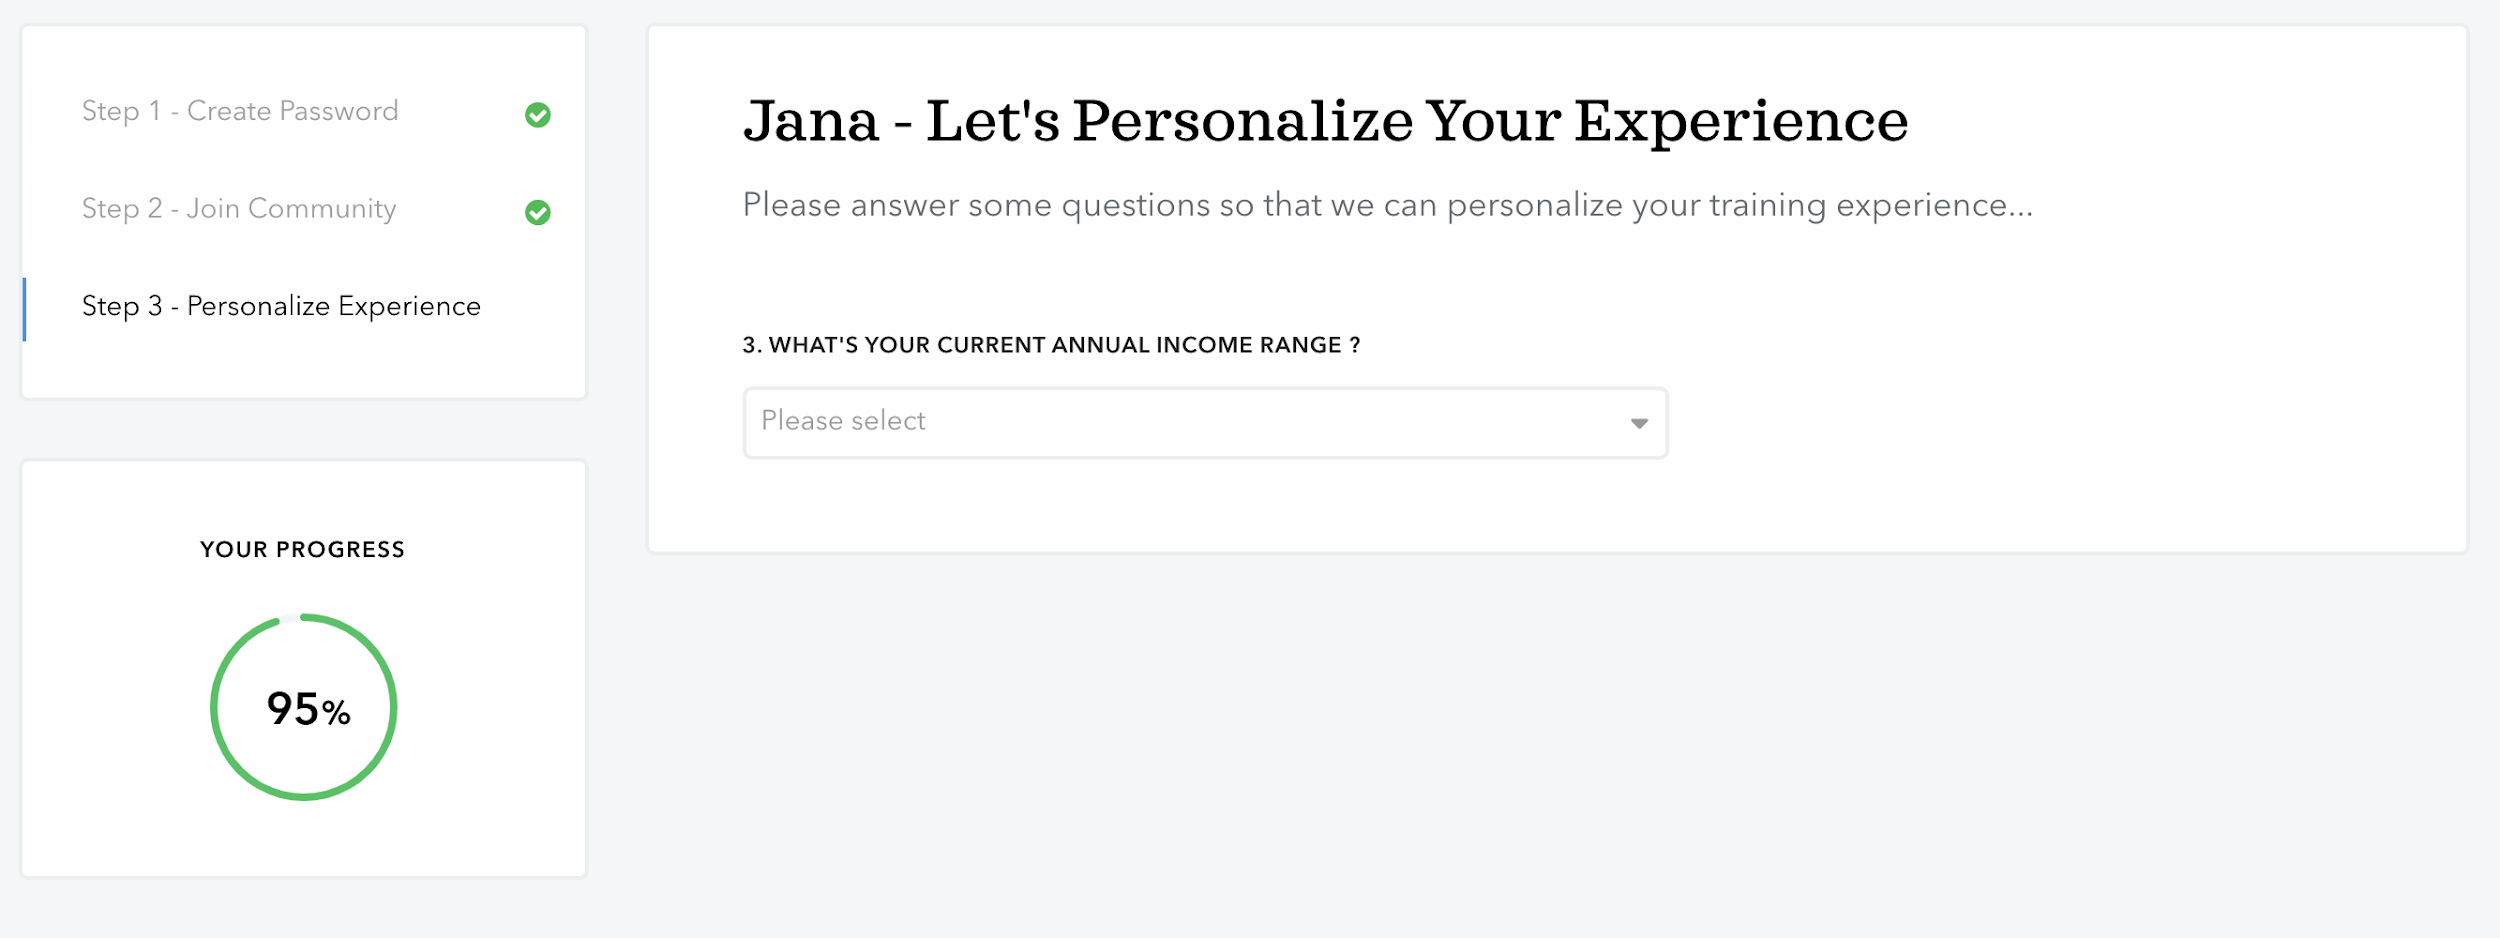
And after that you will finally have access to their learning portal but they will have something even better- really valuable insights about their target customer.
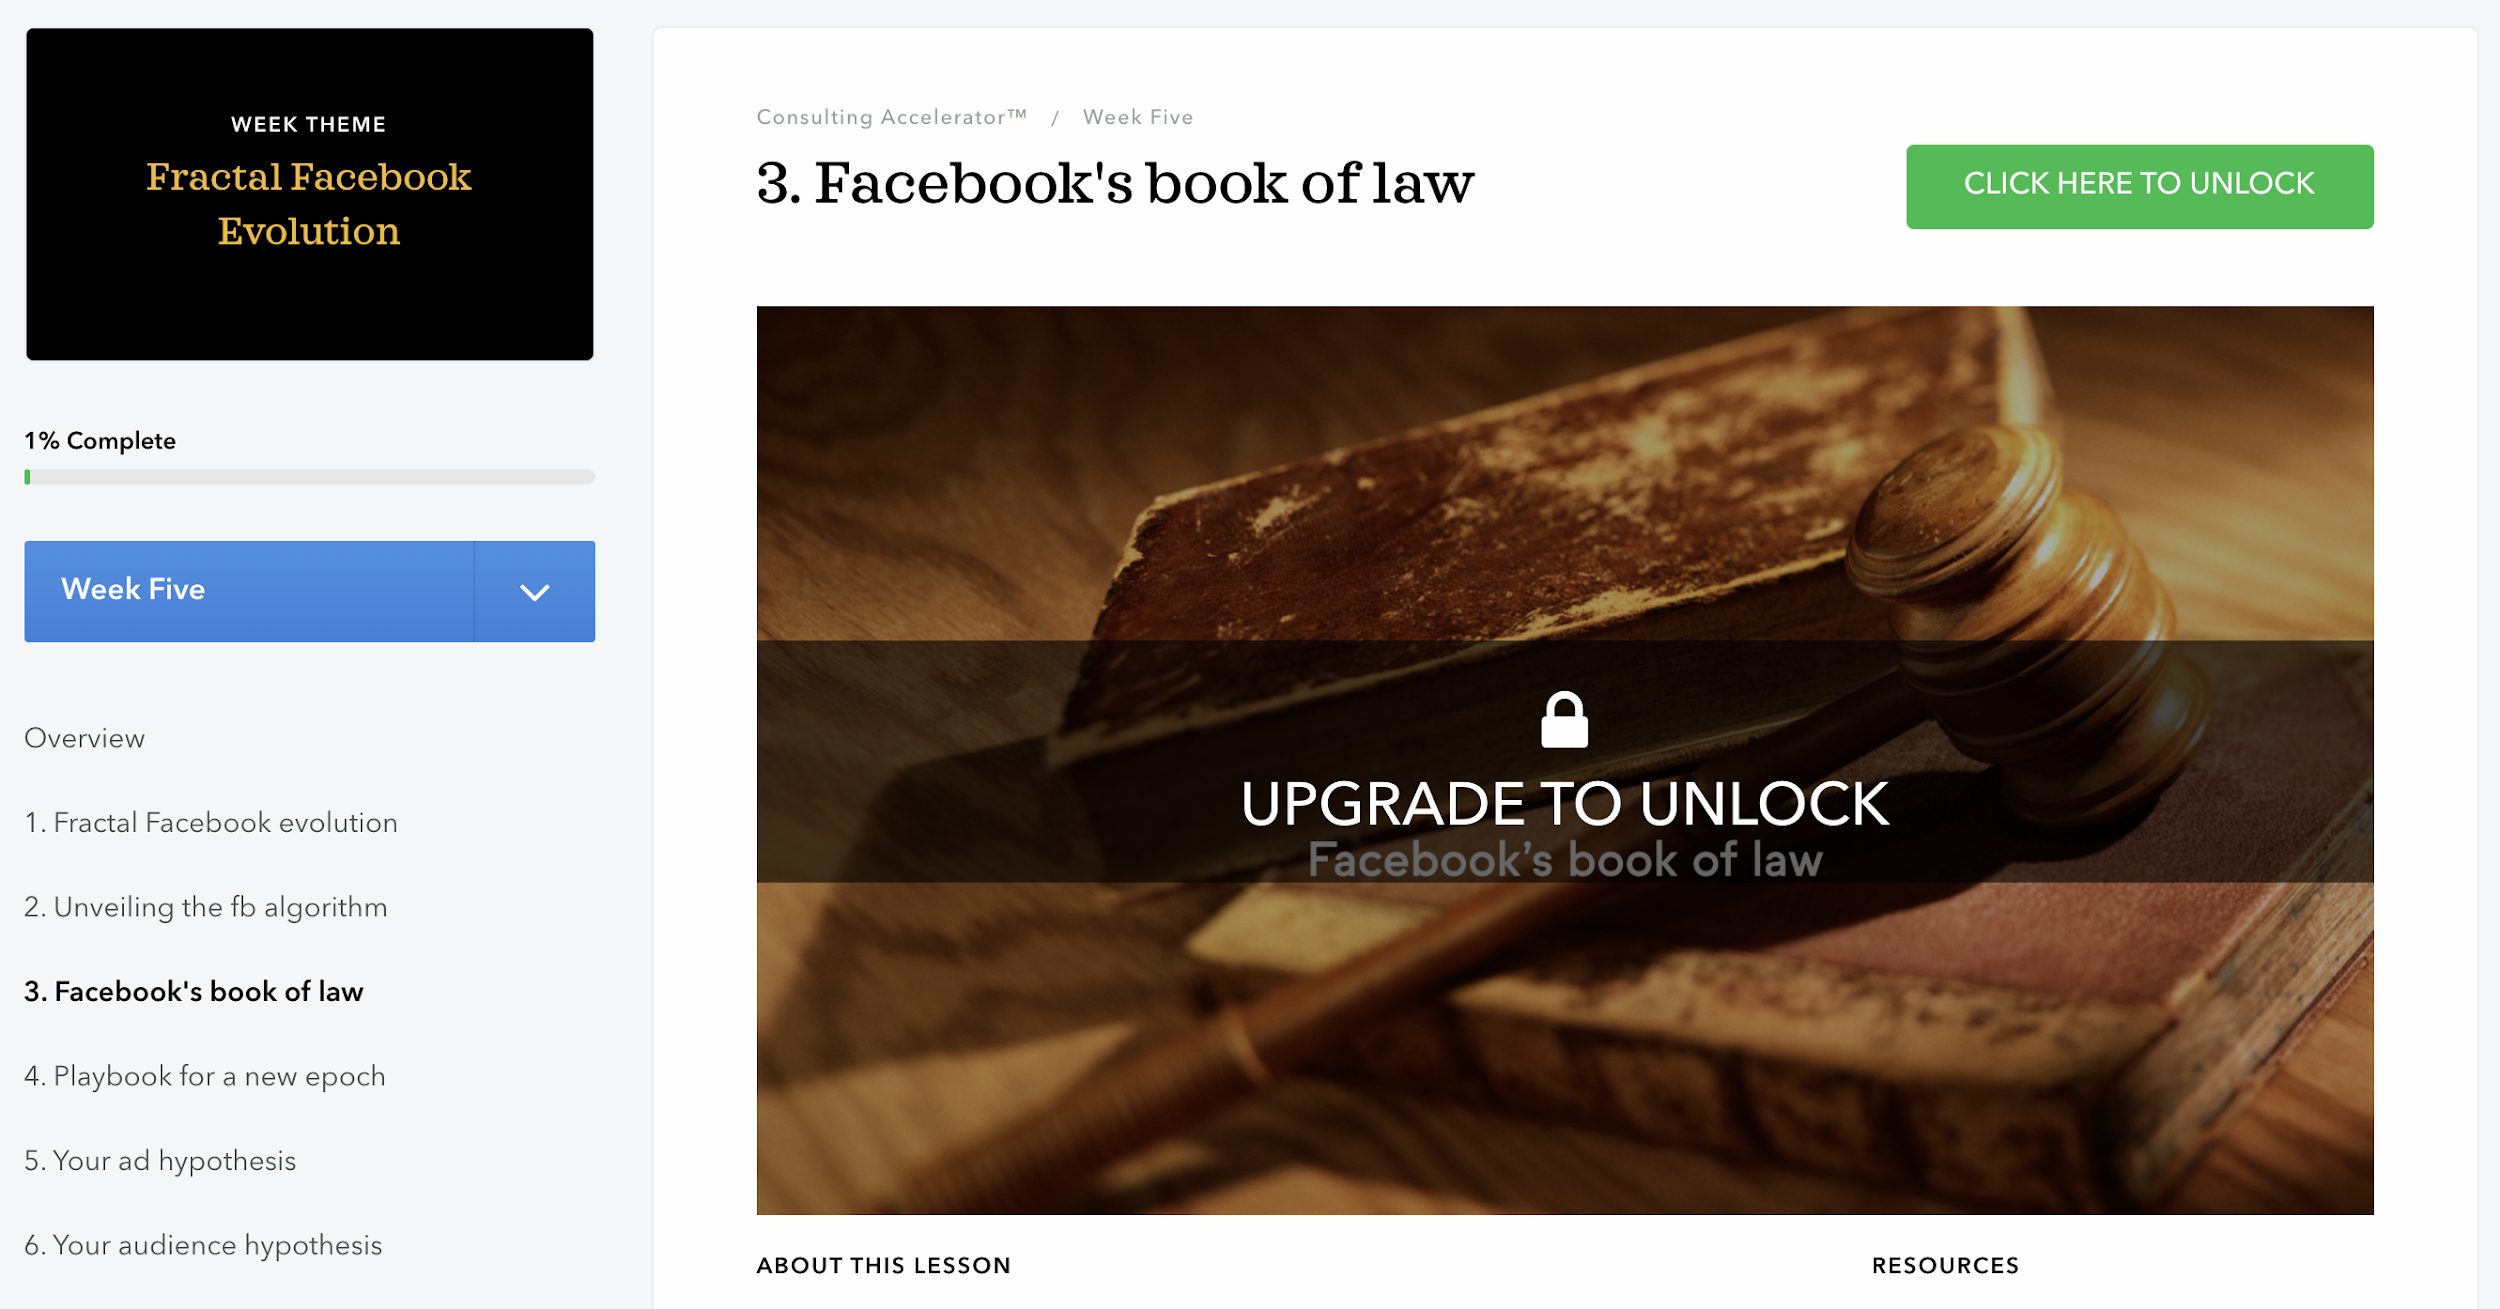
After 7 days your credit card is gonna be charged and you’ll have full access to all of the modules, lessons and resources.
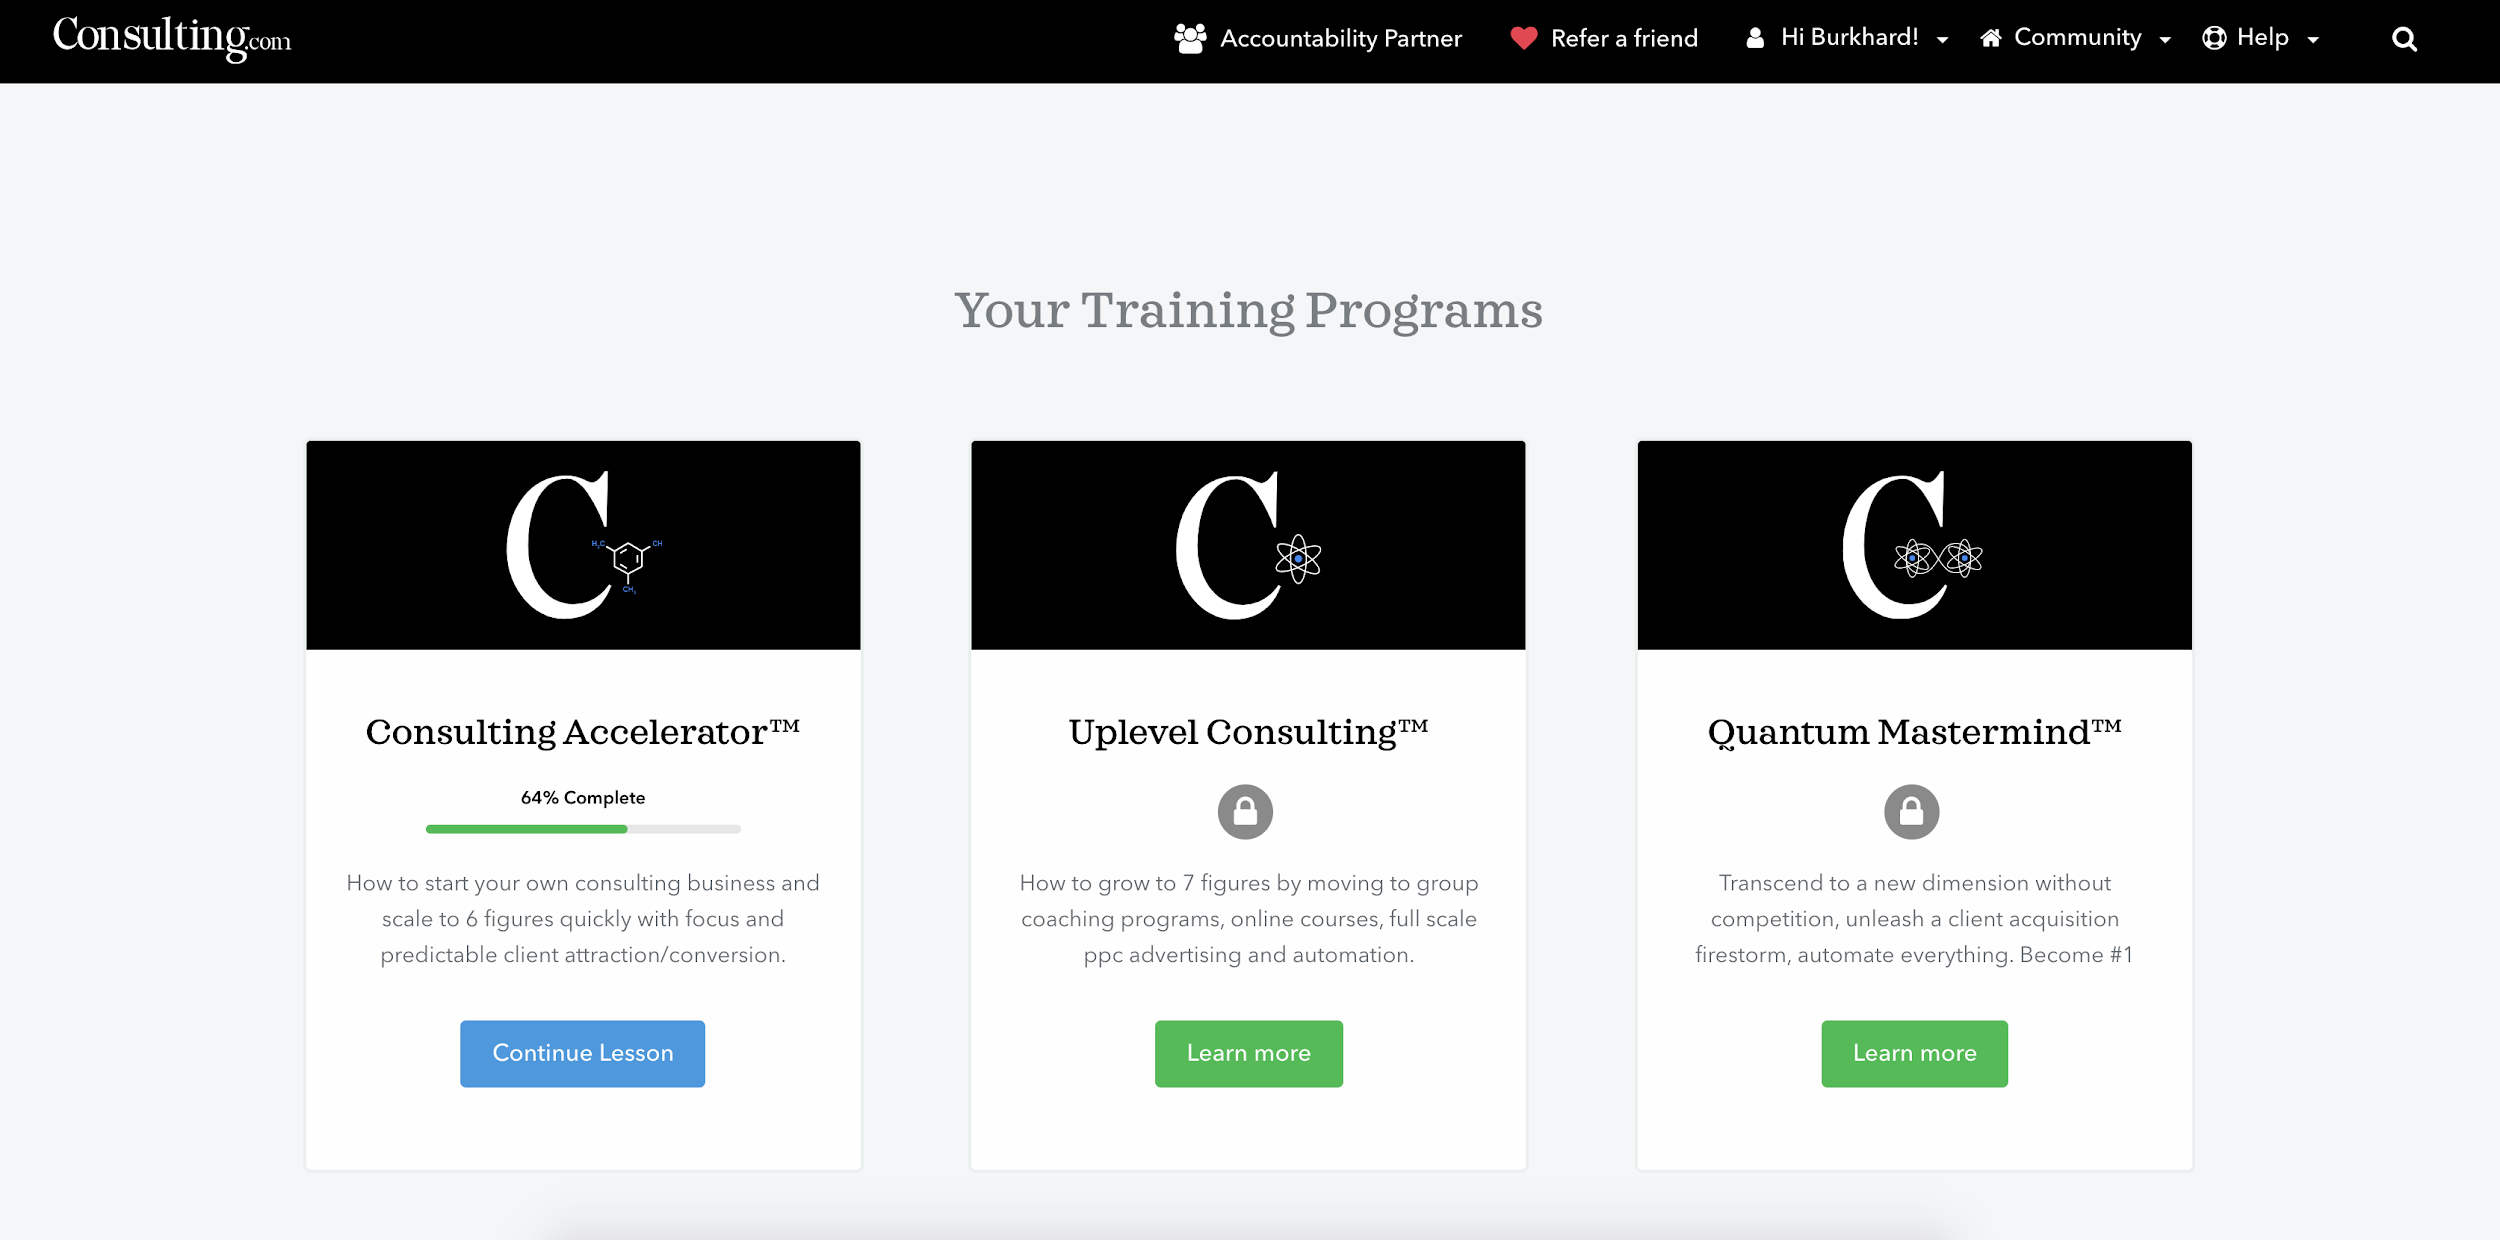
After you buy the program, you will also be able to buy their other programs like ‘Uplevel Consulting’ and ‘Quantum Mastermind’ as well.
This is a great way to maximize Consulting.com’s profit and it’s known as a ‘profit maximizer’.
When is this funnel used?
Usually, a lot of SaaS companies use a free trial to get customers to start the buying process because most customers do not want to spend their hard earned money all at once for something they are not sure about.
The customer can take some time to get to know the service and the company before having to decide whether it is something that he wants to invest in.
What makes it unique?
In general, free trial funnels are not that unique anymore because more and more companies are using them. What is more unique about the Consulting.com funnel is that I rarely see that type of funnel in the online course world.
Based on the fact that Sam Ovens (the founder of Consulting.com) is using this funnel for more than a year now shows that it is working well for him and his business.
An important insight to take away from this is: To establish an ‘out of the box’ mindset is always a good thing when it comes to business, marketing and sales (and maybe even life).
#3 The ‘Mailshake’ Sales Funnel
Type of sales funnel: ‘Book A Demo’ / Phone Funnel
Mailshake is doing a great job when it comes to their sales funnel. I love their straightforward ‘Book A Demo’ call to action which isn’t that common in the SaaS industry but it works great.
This is a good sales funnel to depend on if you have high-value items you want to sell or products and services that are in need of explanation or if your customers tend to want to talk to someone 1:1 before buying the service.
What does this sales funnel look like?
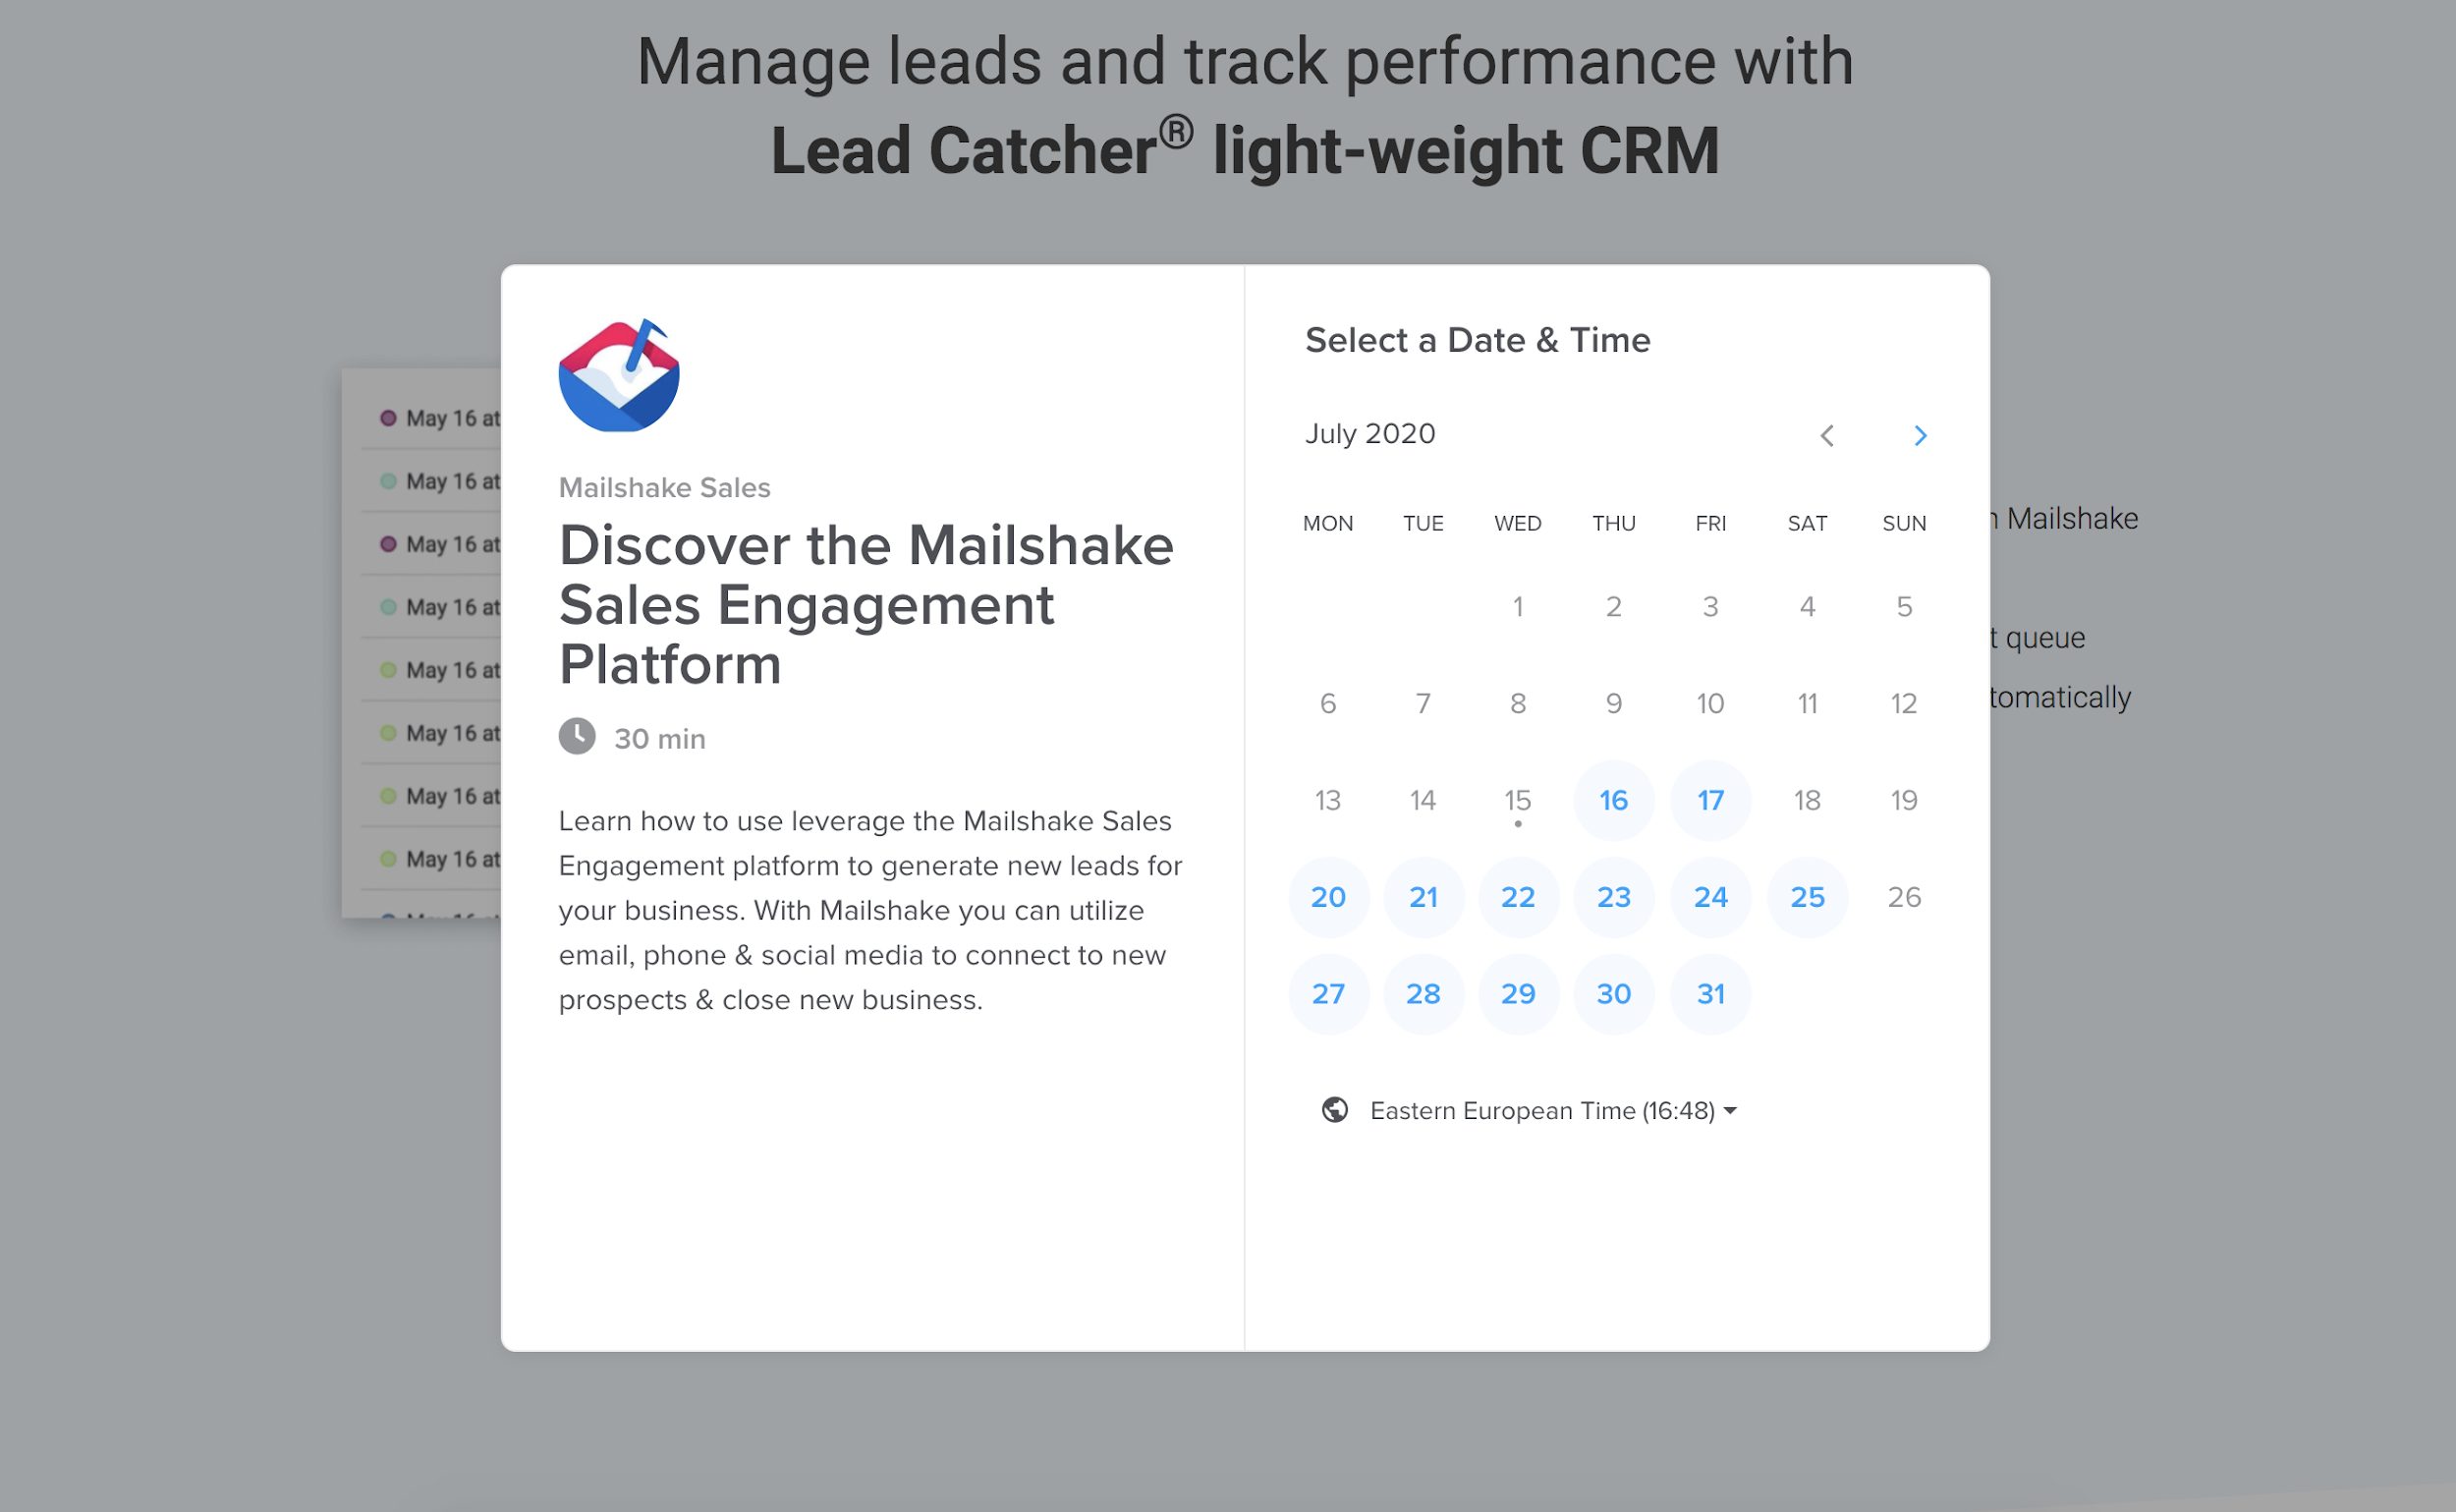
Once the user is directed to the landing page that offers the free demo, they are prompted to sign up for it on a date of their choice.
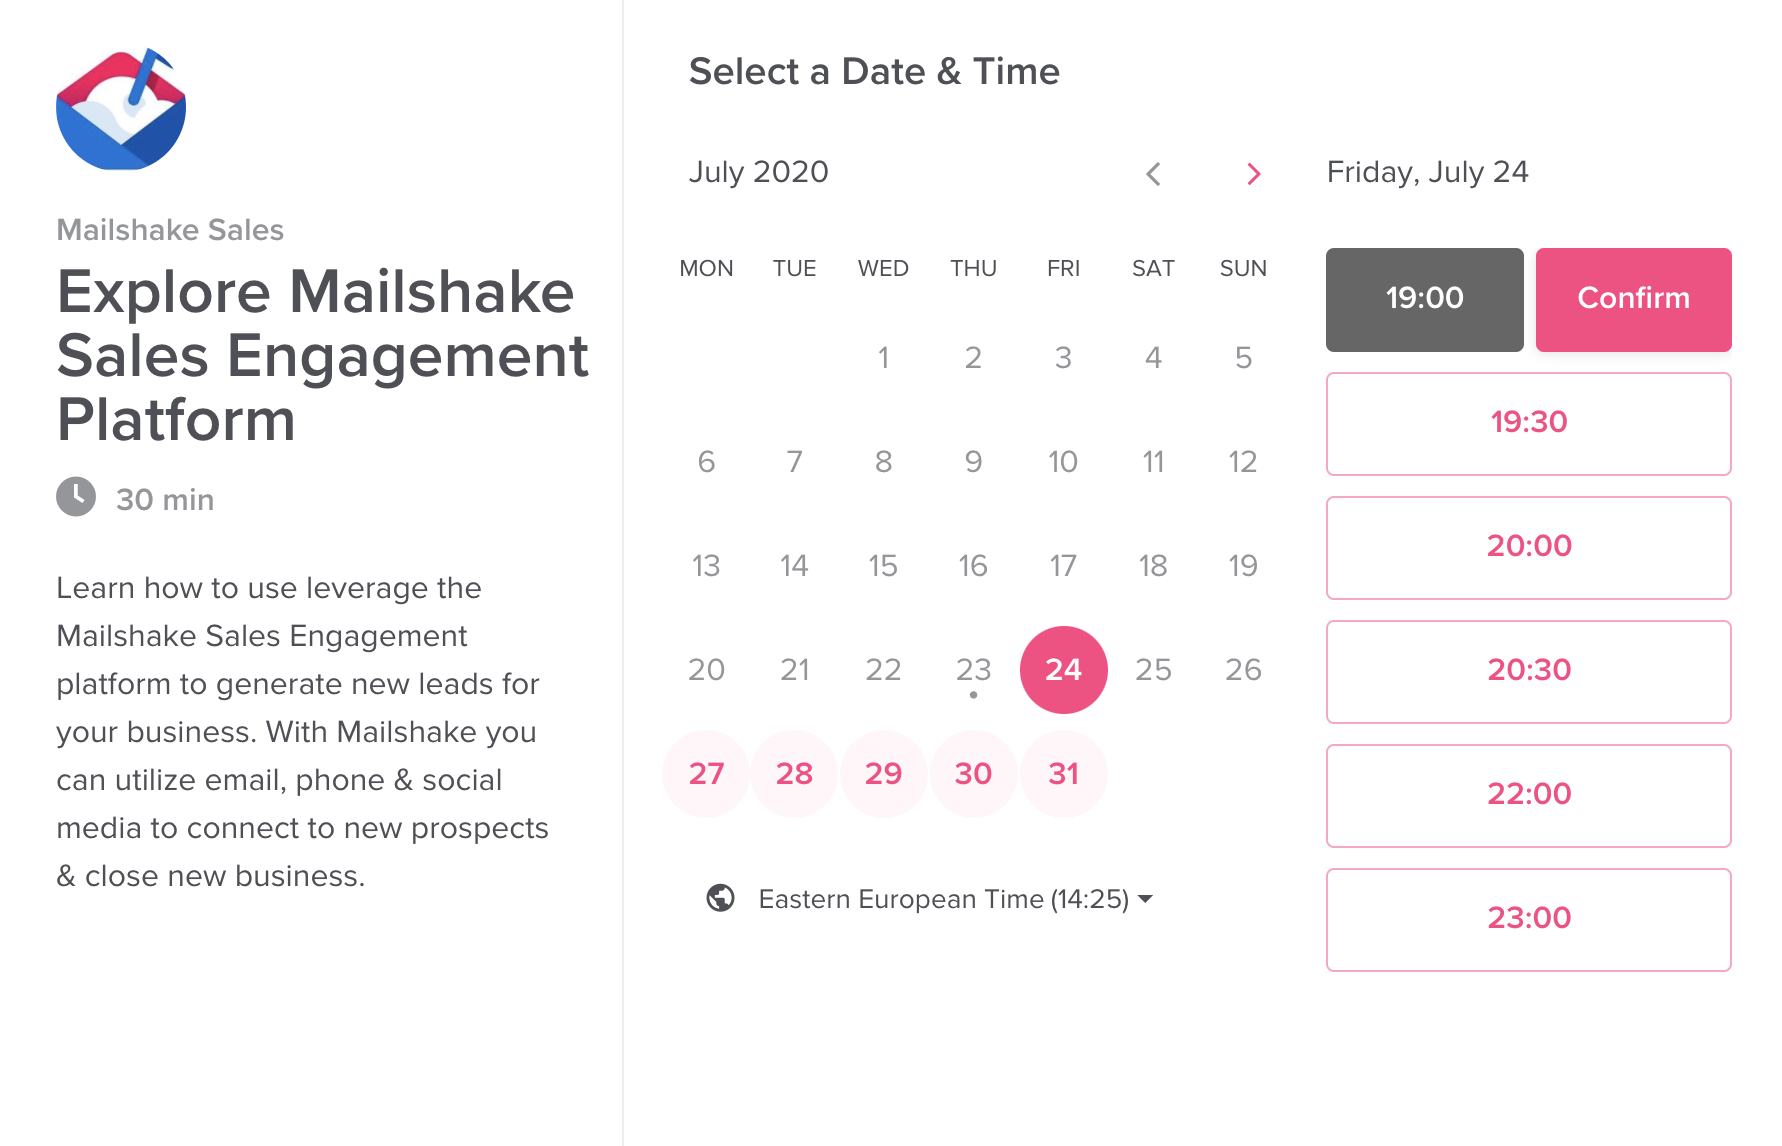
As soon as the potential customer types in his personal and company data, he’ll receive an Email from Mailshake including a link to a 30 minute ‘Explore Mailshake’ Zoom call.
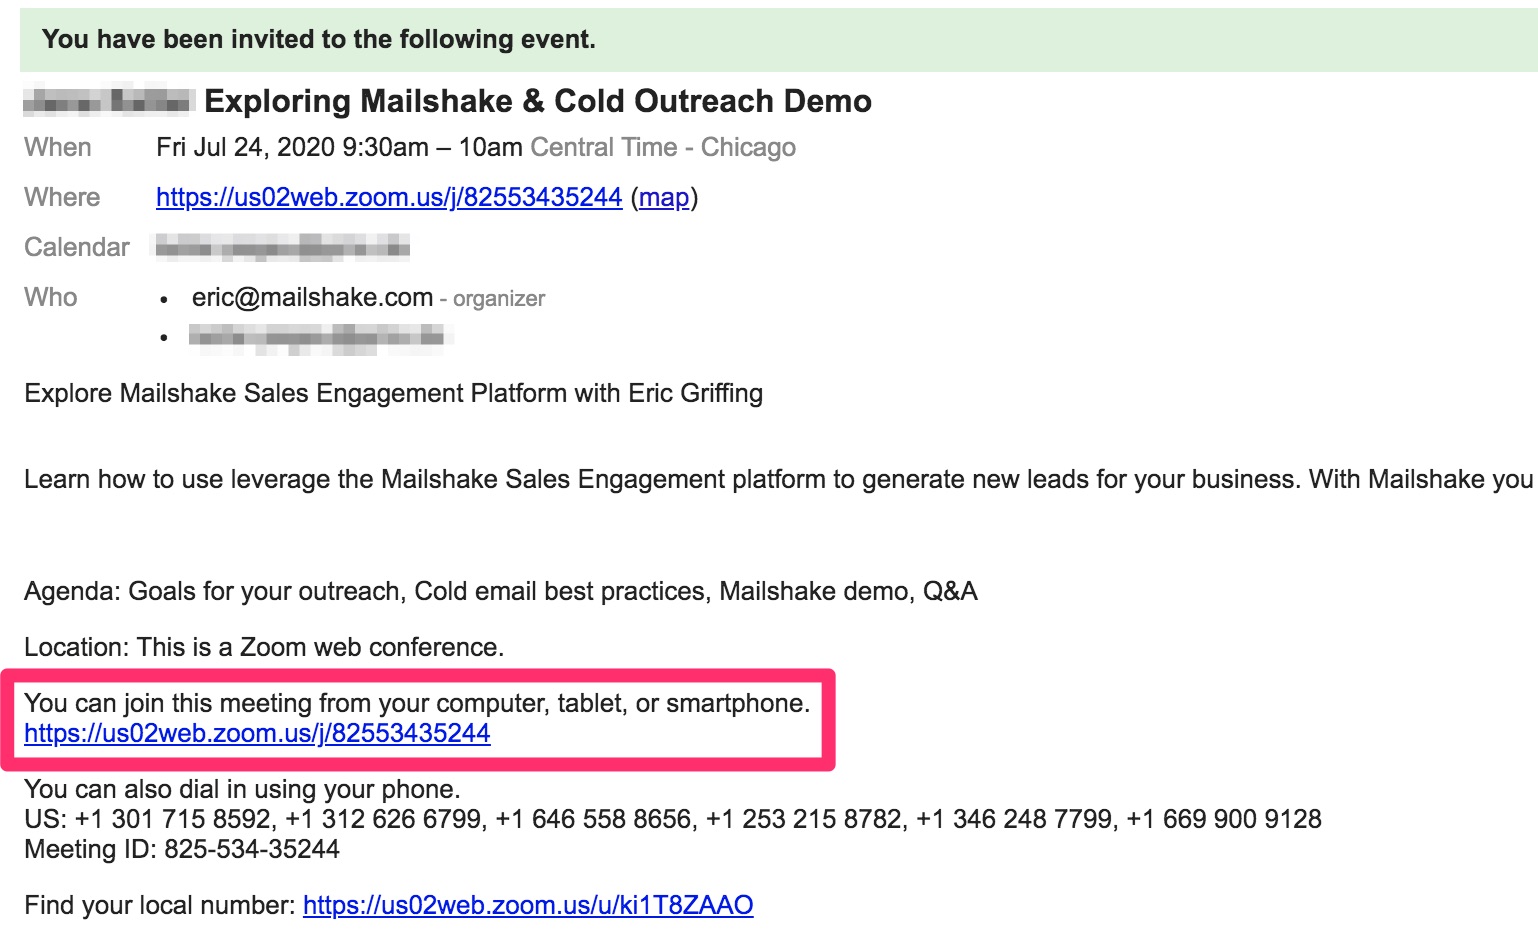
At this point, Eric would tell the customer all about the platform (along with all its crazy benefits like:)
- Email outreach on autopilot
- Integrated phone dialer
- Seamless social sales acceleration
- Lead Catcher® light-weight CRM
- and many more
If the customer feels like they could really benefit from these services and perks, Eric will go on to offer him a fair and affordable price.
This means it really is up to you whether you manage to convince the customer to sign up or not.
When is this funnel used?
A ‘Book A Demo’ / phone funnel is normally used when you want to target customers that need personalized advice with the possibility of investing in a high-value service or product down the line.
In case you’re wondering what tool Mailshake is using to schedule those Zoom calls – it’s Calendly, a great scheduling software that I used a lot of the time myself. But you can also pick one of the numerous Calendly alternatives if they better fit your business needs.
What makes it unique?
For example, a company such as Boxmode believes that this funnel is really effective for companies who sell services like web design software, photo editing software, etc. that ordinarily need tutorials to be used.
The main advantage of a 1:1 call is that you can build up trust with your customer in the best possible way which in general helps conversation rates skyrocket.
#4 The ‘OptinMonster’ Sales Funnel
Type of sales funnel: ‘Convert Everybody’ Funnel
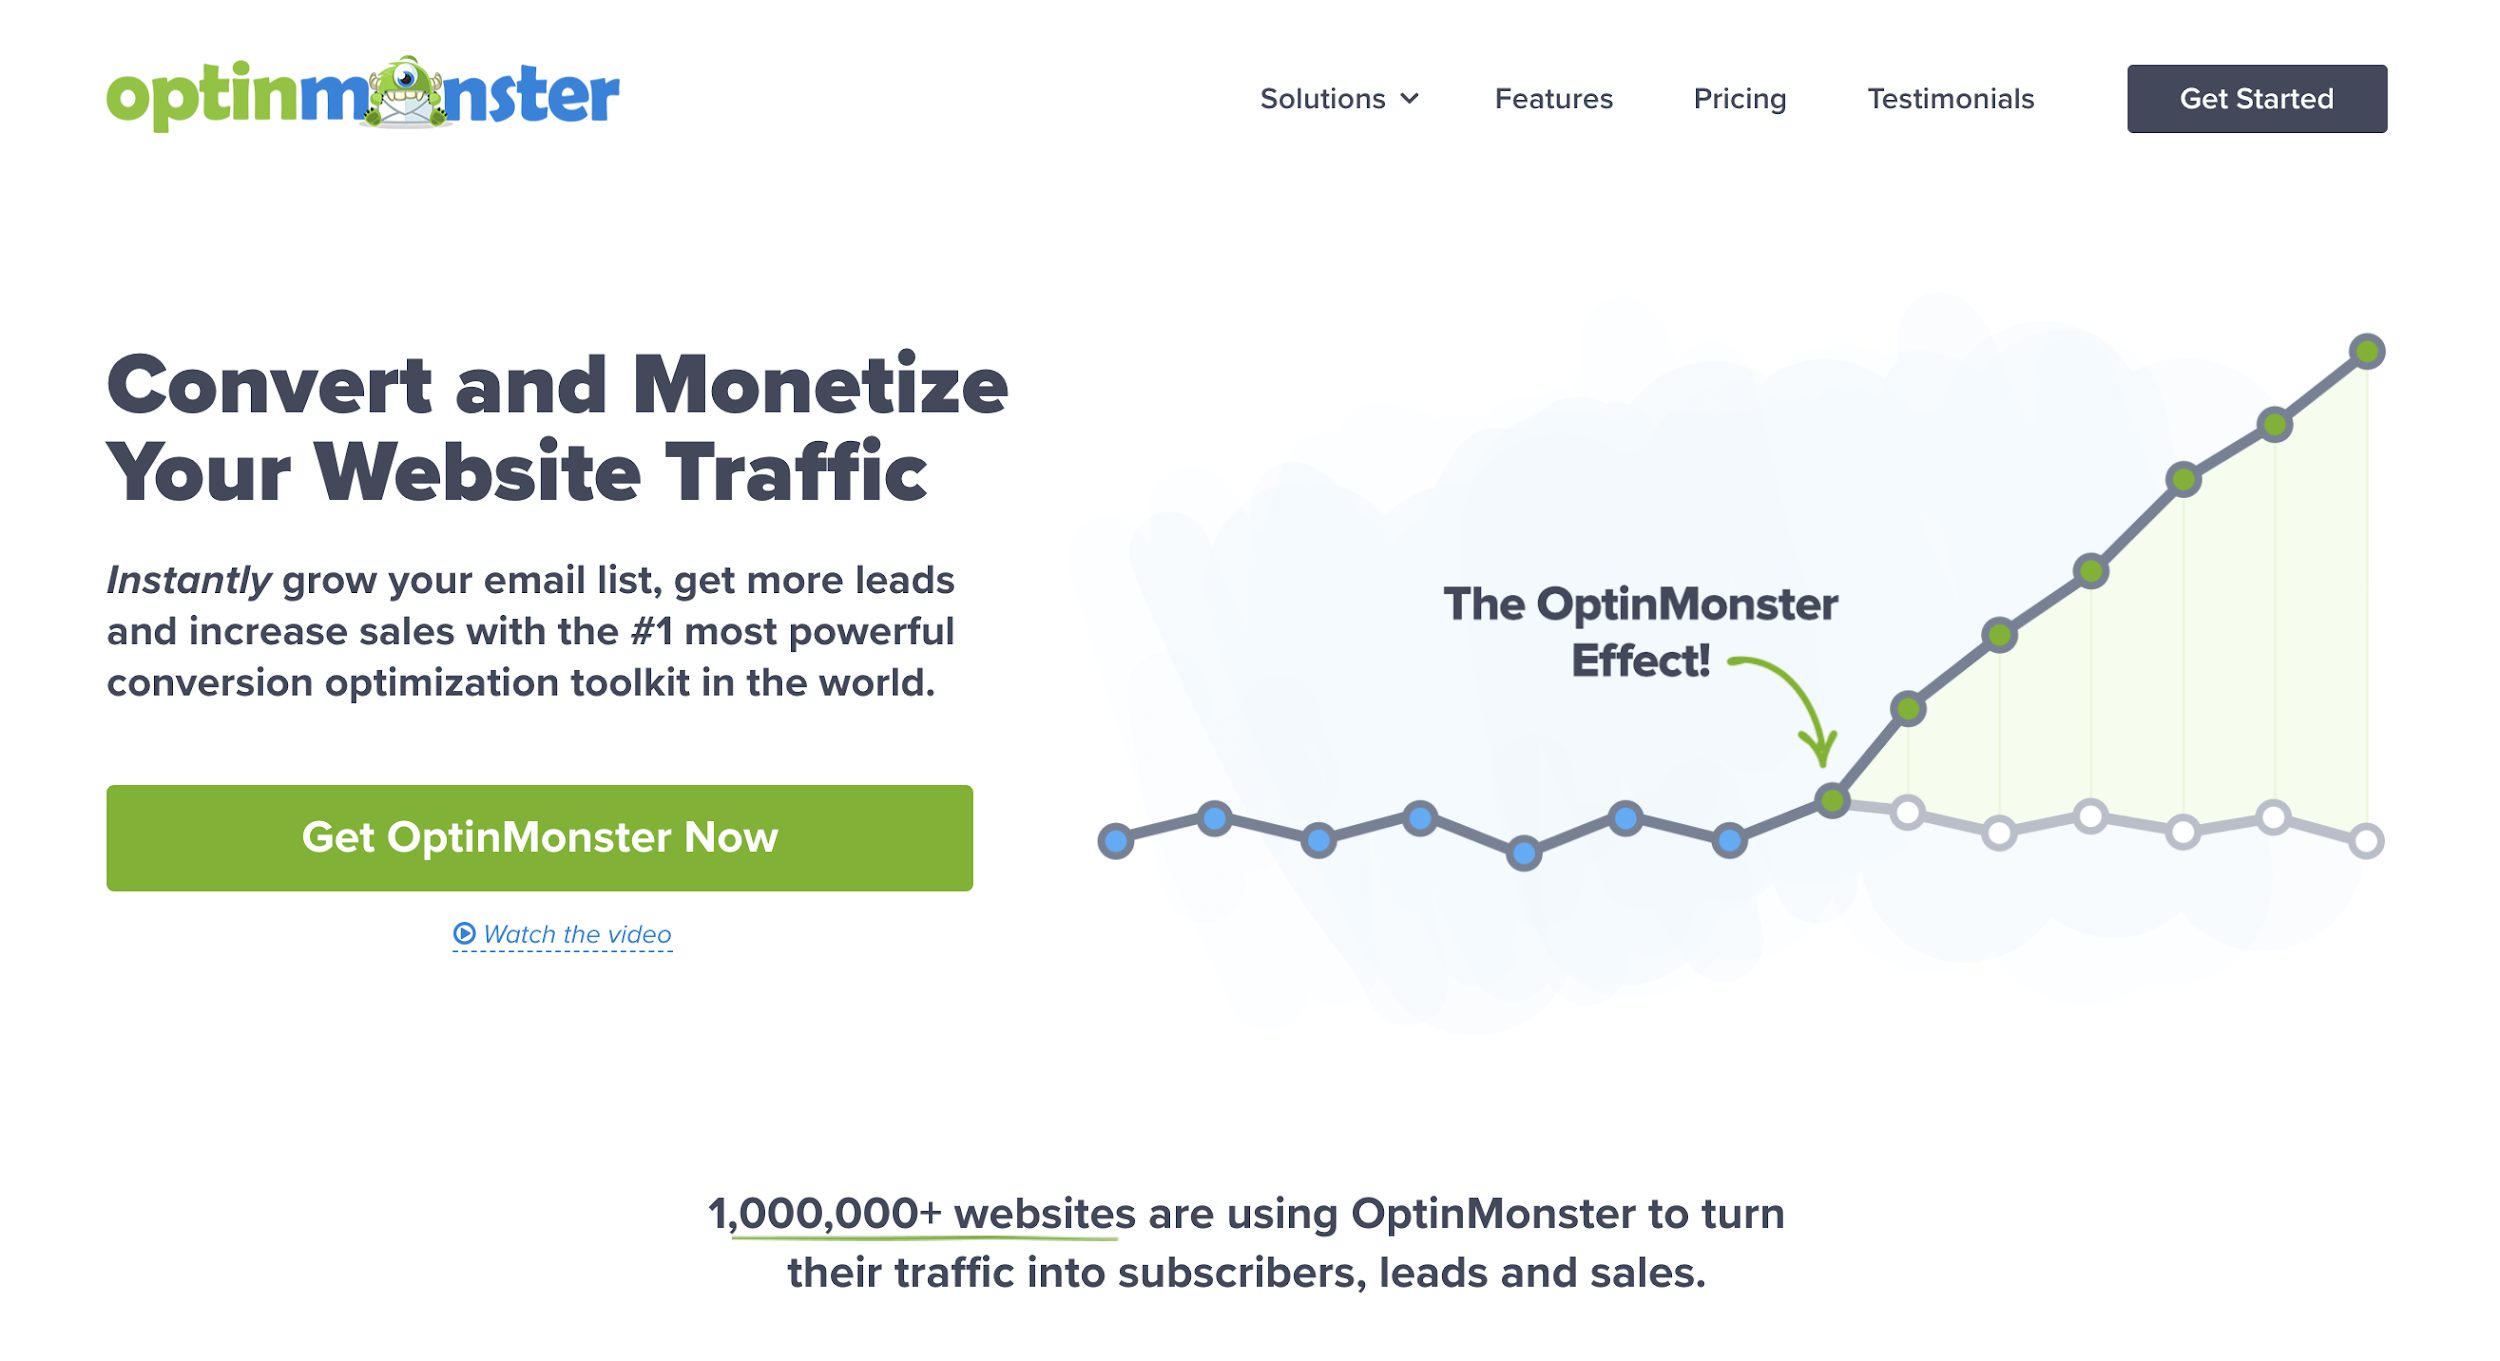
OptinMonster works on the logic that every reader is a potential conversion which is why they use multiple sales funnels to bring in new customers. They use a wide variety of tools, sales techniques that play on your psyche, tricks, and hacks such as- a countdown timer, exit popups, content upgrades, lead magnets for their opt-in forms, case studies, and more.
They also offer lower prices to customers that agree to be billed annually. One of their most common sales funnels is an exit-intent popup that looks like this-
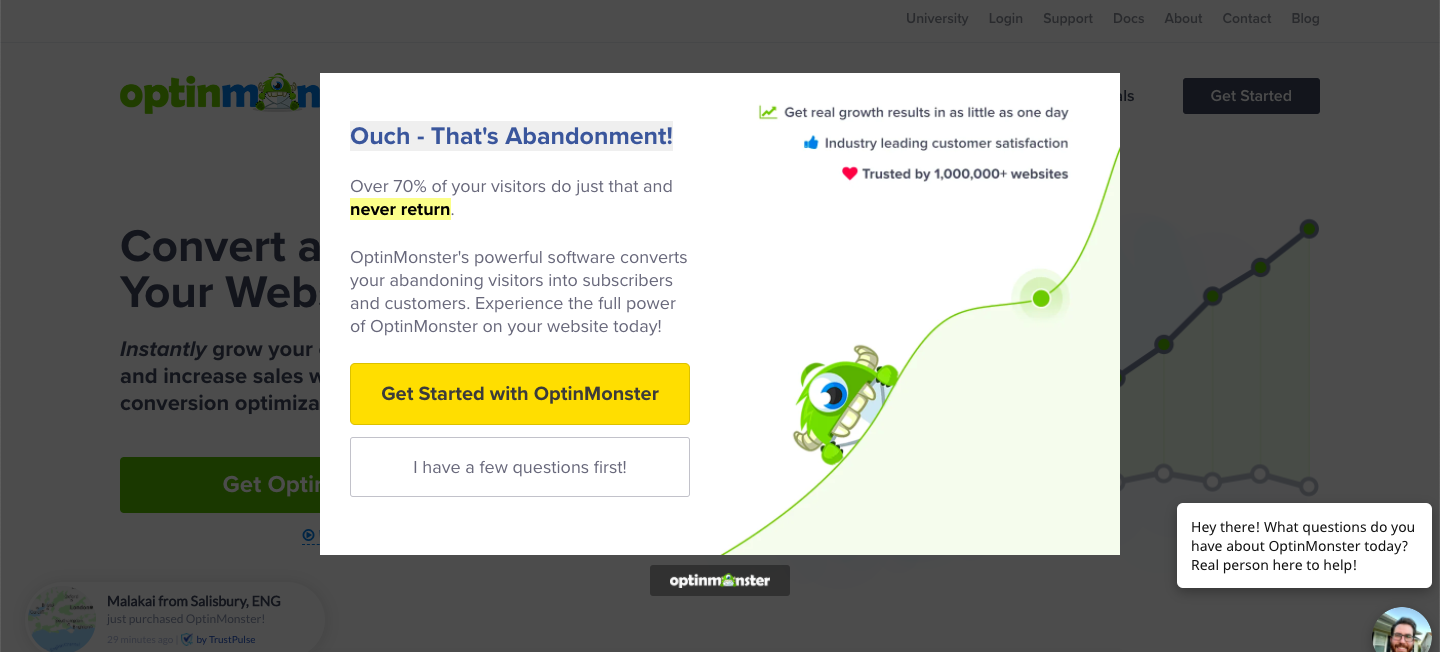
This is what will pop up if you try to leave the OptinMonster site. It works extremely well since it convinces customers that may never come back to give OptinMonster a chance. It reels in customers that are almost ready to close the tab which prevents them from losing potential customers.
What does this sales funnel look like?
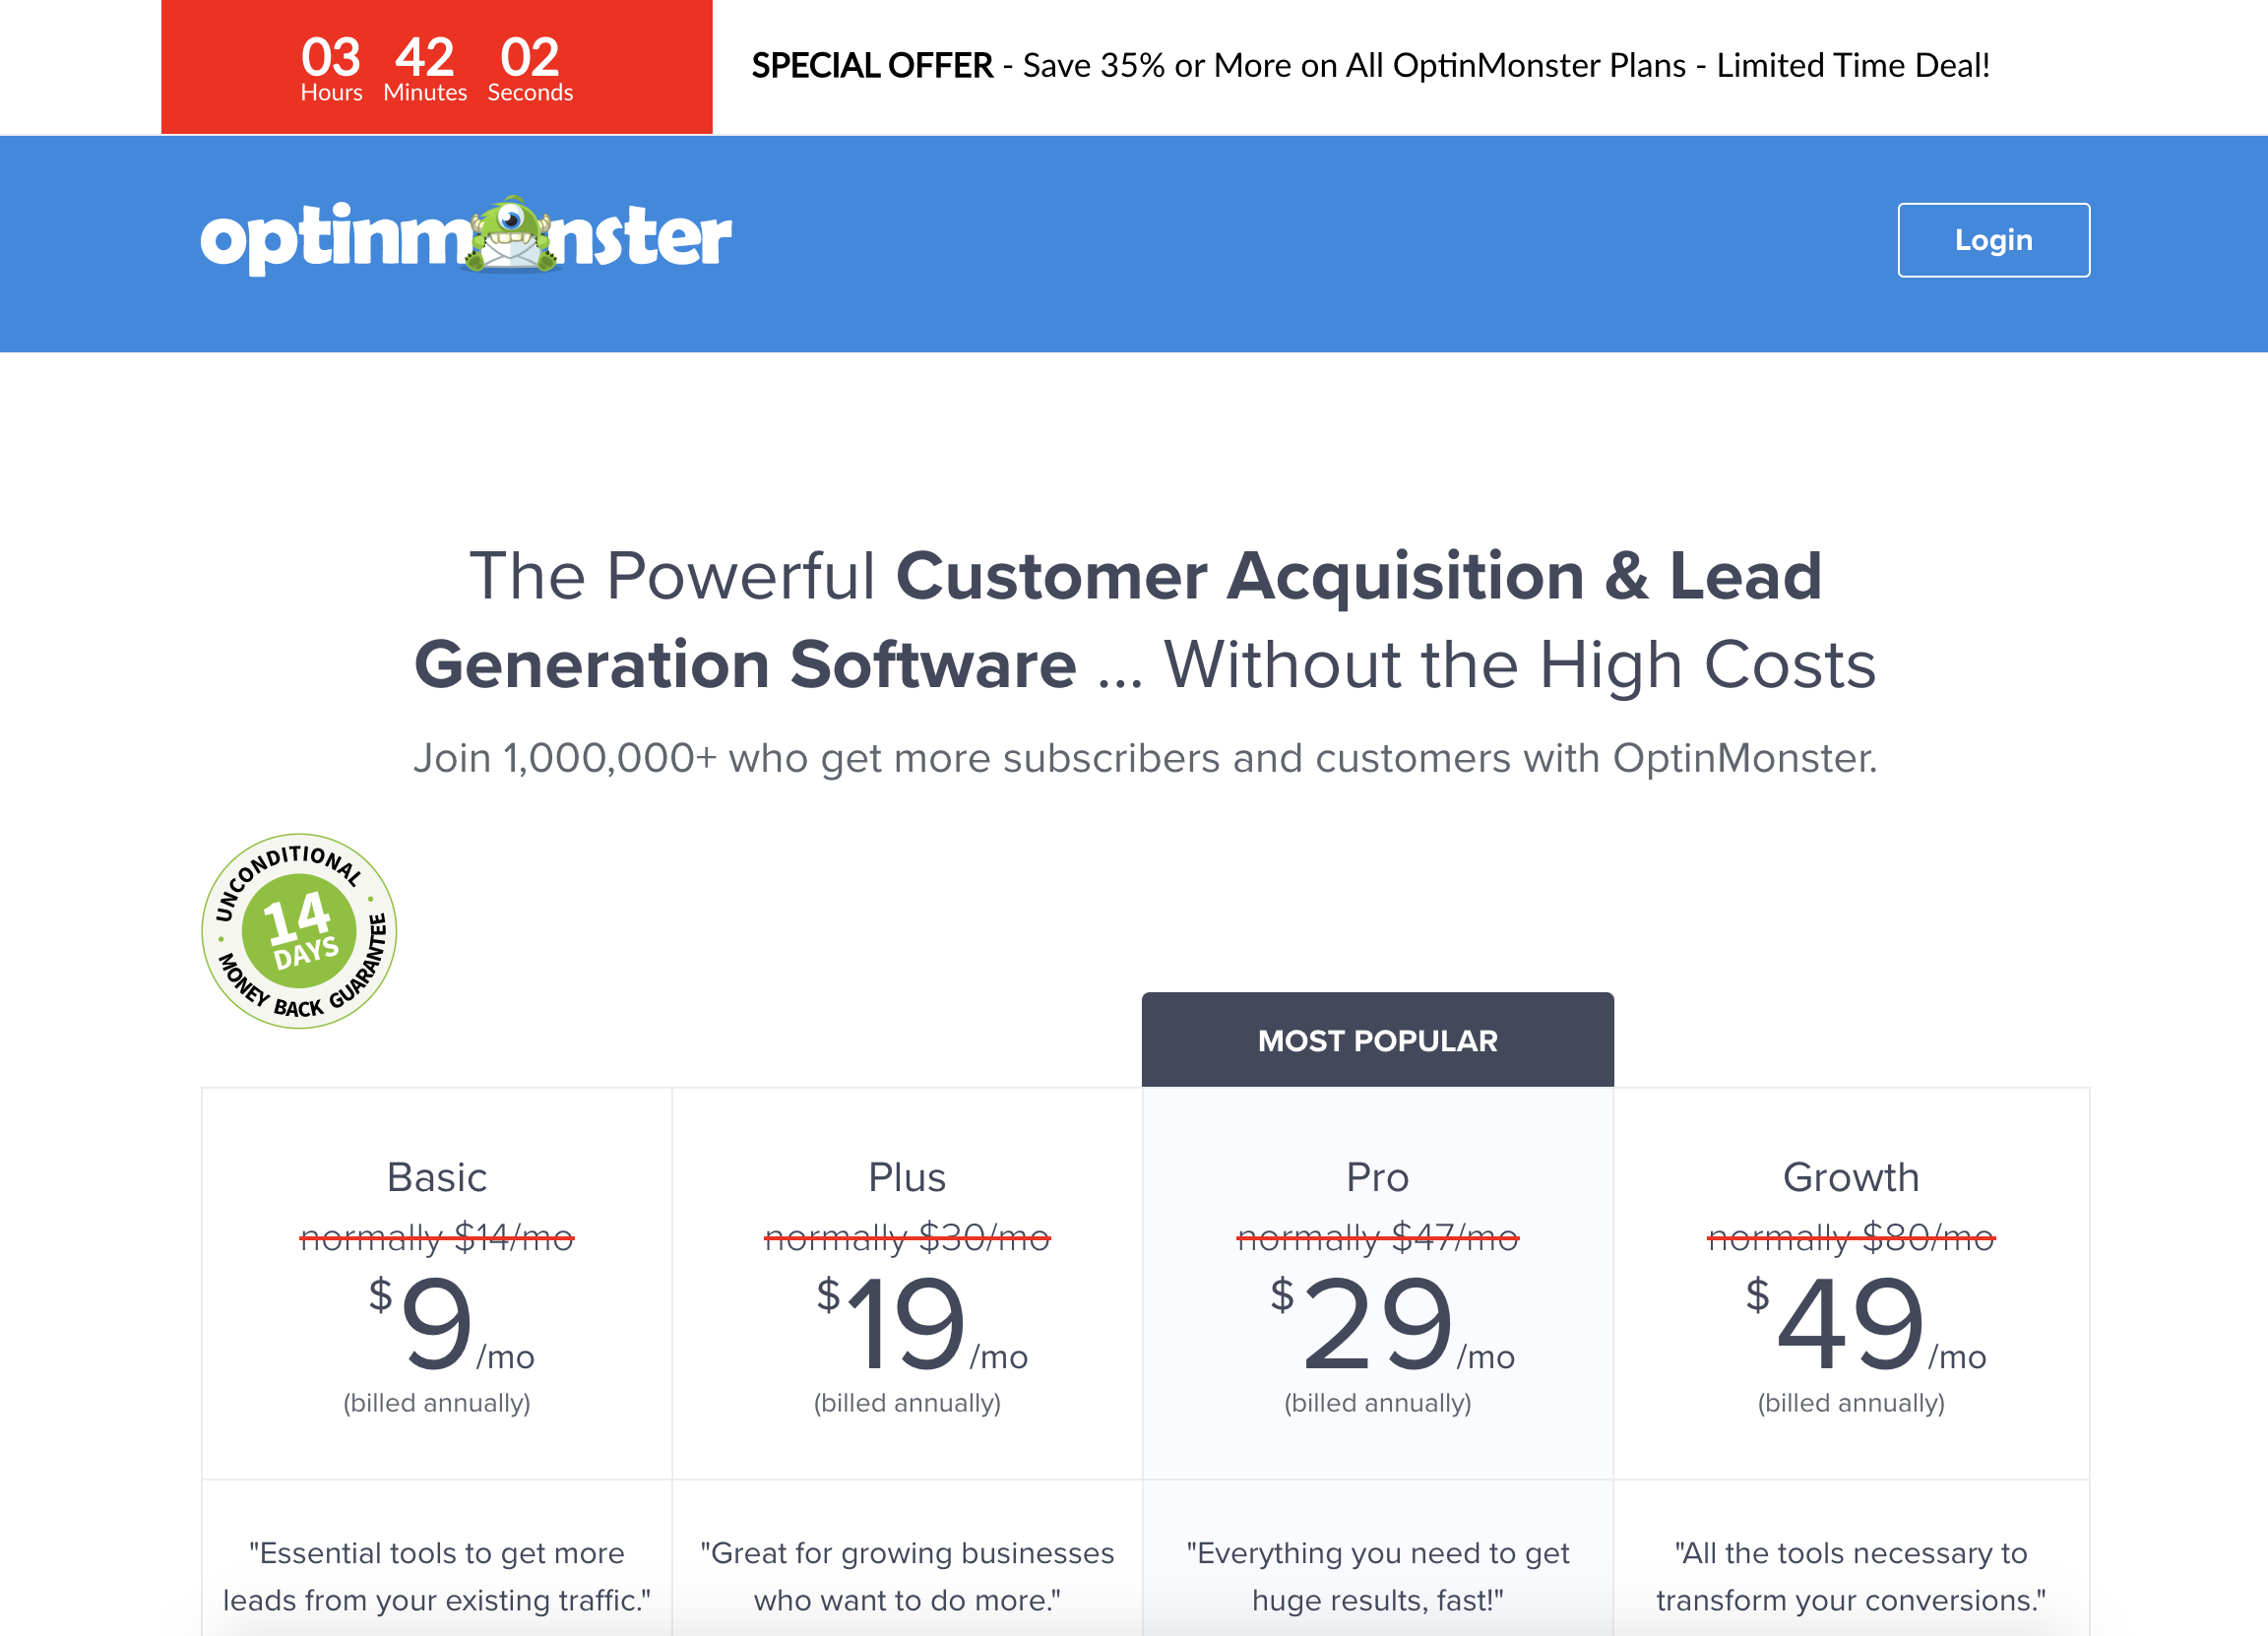
Most of the sales funnels used by OptinMonster use a sense of urgency to trigger a response from customers. Once a customer lands on their landing page, they use stuff like countdown timers or slashed out prices to convince them to take the final leap and enter their much-coveted email address.
Why are these funnels used?
Funnels that trigger a sense of urgency or that have a last-minute discount connected to it are very effective in convincing customers that are unsure to opt-in for a freebie.
What makes it unique?
OptinMonster’s ‘Convert Everybody’ logic is insanely good at taking advantage of every visitor that walks through their virtual door. Unlike most companies that use only one or two sales funnels to convince visitors, OptinMonster uses multiple different techniques to convince customers to take the leap.
#5 The ‘Backlinko.com’ Sales Funnel
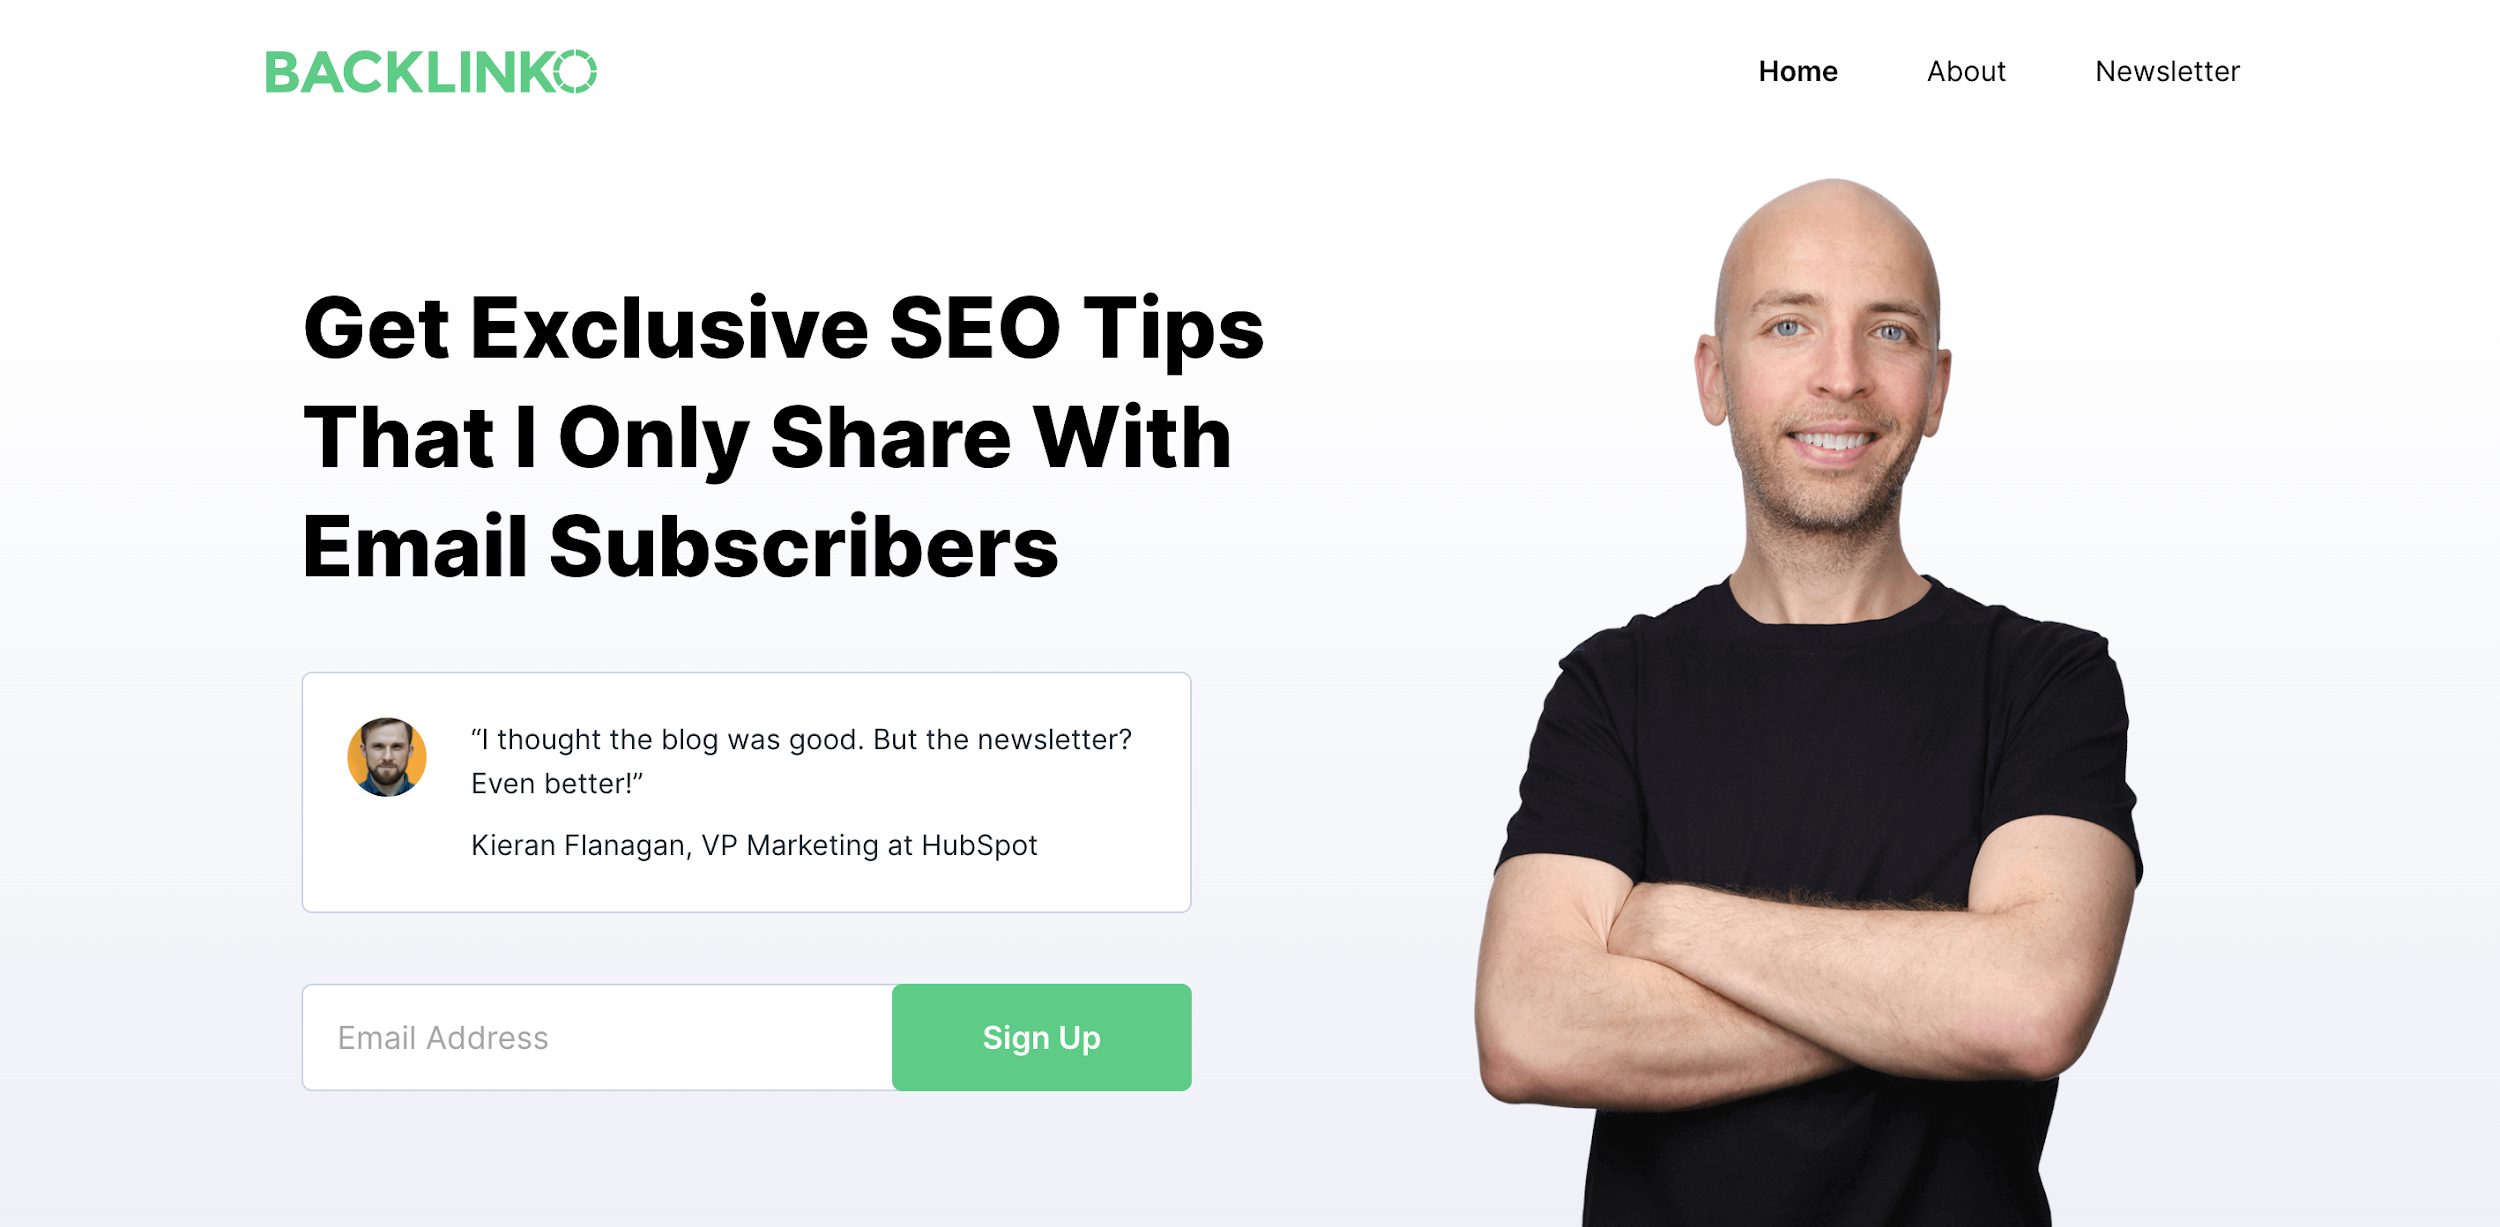
Type of sales funnel: Email Funnel
Brian ranks for a lot of high-volume keywords across Google and Youtube which is his primary traffic source. Once he manages to get people on his website, he tempts them with a variety of lead magnets that prompt them to fill out a form with their email.
He then uses this list of subscribers to sell his courses and products to-
Brian says: “Today, outlets like Forbes feature my course business as a “one-person seven-figure business” unicorn.”
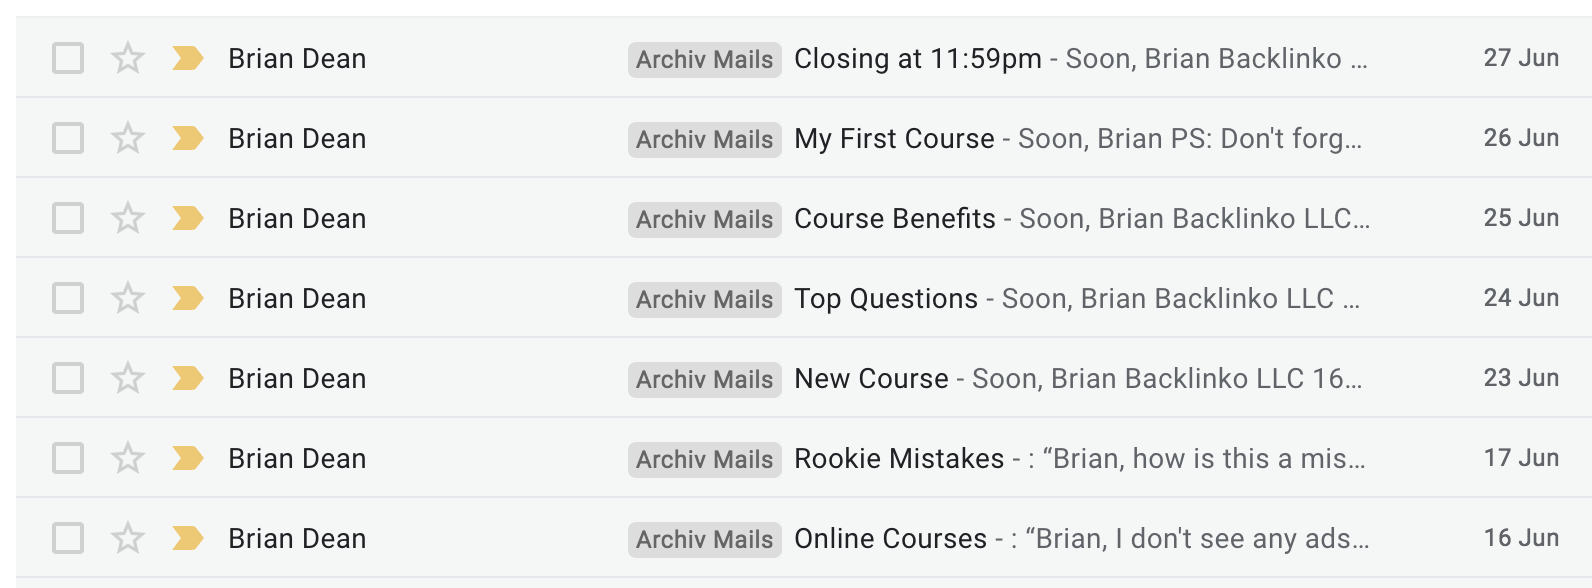
What does this sales funnel look like?
Once someone is added to Brian’s list of email subscribers, he sends them various informative follow-up emails that help foster a relationship. After a while, he suggests his various courses to his new subscribers that have grown to trust his expertise.
Why use this funnel?
This funnel is an affordable way to bring in sales and works especially well for bloggers who are looking to sell their courses online.
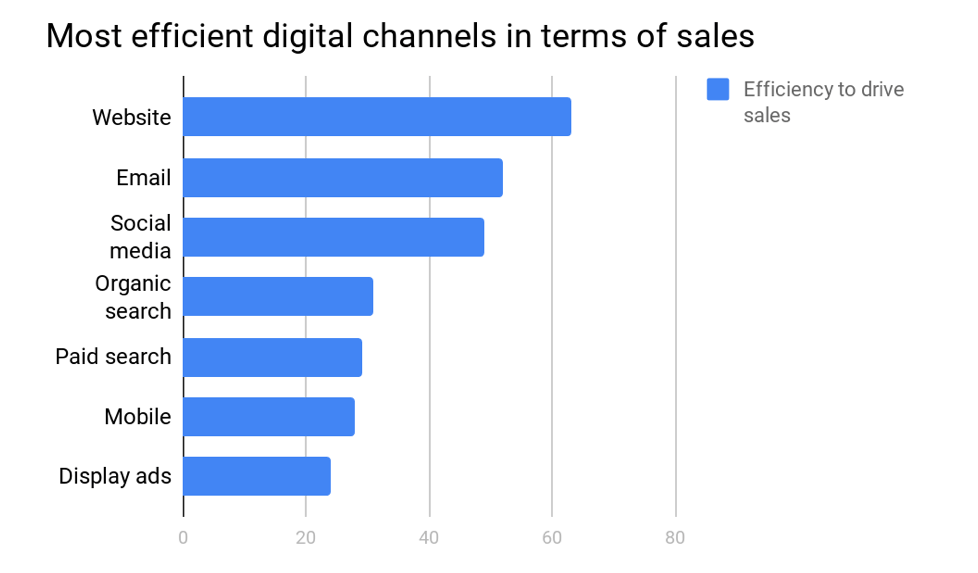
It also proves that if you think ‘Email is dead’, that it is actually the very opposite that is true.
It is still one of the most important and effective digital channels to sell products through.
(Source)
What makes it unique?
Brain relies on the relationship he creates with his subscribers to sell his courses which means that he has a life-long customer in each one of his subscribers.
If you follow Brian for a while (which you definitely should be doing), you will also notice that he is a master at ‘cutting out the noise’ and ‘focusing on ROI producing activities’ like driving traffic and email marketing.
He lays less emphasis on short-term wins like social media and spends more time on the stuff that will give him the best long-term profit.
#6 The ‘Gymshark’ Sales Funnel
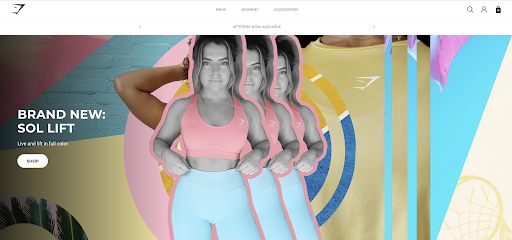
Type of sales funnel: ‘Influencer’ Funnel
Gymshark is a sportswear eCommerce empire that has grown to over £41M in Sales.
It depends largely on influencer marketing which is a type of marketing strategy that relies heavily on influencers that have a large following on various platforms.
Gymshark is a good example of the influencer funnel because they rely on athletes who have a huge following of people that depend on them for advice and trust their opinion.
This has helped Gymshark become a brand in its own right. People recognize and trust the name which has helped them increase their own social media following and reach more people.
Here is a breakdown of Gymshark’s web traffic and where it comes from:
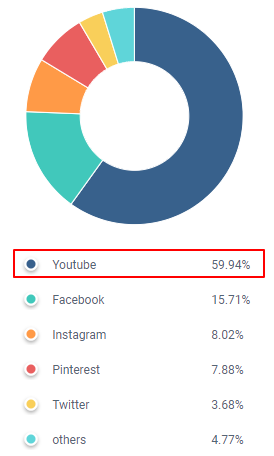
Image via Beeketing
As you can see, most of their traffic comes from social media. This is because they are constantly working alongside fitness celebrities and influencers to market their products.
Alongside growing their only social media accounts to millions of fans and followers, Gymshark practically invented what we now know as ‘influencer marketing.’
They used the already established trust that certain personalities online have to sell his own products and grow as a brand.
What does this sales funnel look like?
Gymshark reaches out to athletes that have a highly engaged audience on a certain social media platform.
They will then compensate the athlete for advertising their products on their social media accounts. This could be by adding a link to their shop in the account bio or by posting pictures wearing Gymshark gear.
This is what it ideally looks like:
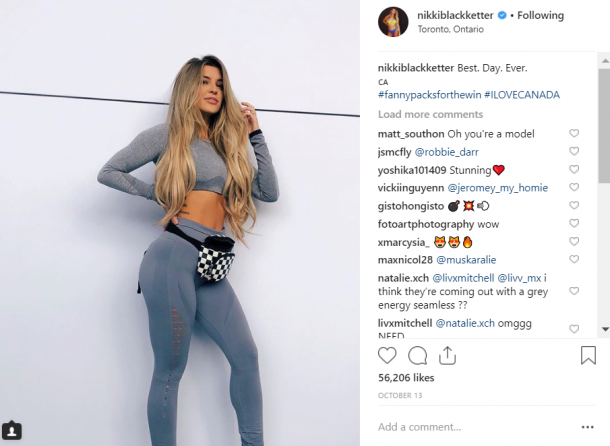 Image via Instagram
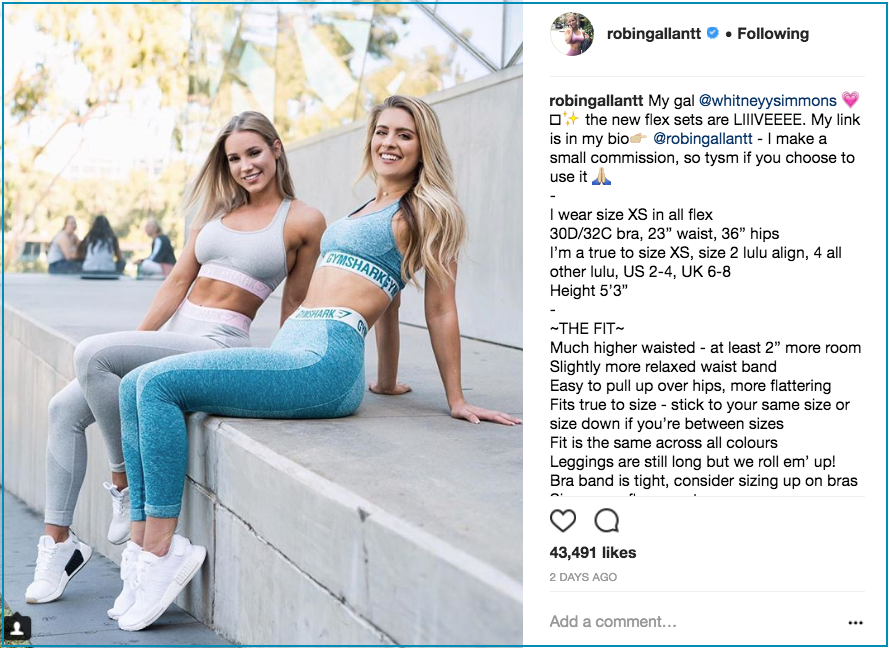
Image via Instagram
This is a far less invasive way of advertising which is why it works so well. The influencer’s followers will happily look forward to a new post instead of the classic groan that follows advertisements on TV or YouTube.
Instead of depending on an algorithm to show your ad to customers that may be interested in your products, you are depending on an influencer with access to your ideal audience.
Why use this funnel?
This is a great funnel to depend on if you want to grow as a brand. It works well with eCommerce stores that have products that can be showcased easily on social media. You will often see food, clothing, technology, and other products being featured on influencer’s accounts.
These products will normally be ‘wants’ rather than ‘needs’. Influencer marketing very rarely works for services or software based products. If you have an eCommerce store that needs to gain traction online,you could consider taking a closer look at Gymshark’s ‘influencer funnel’.
What makes it unique?
Influencer marketing is not very unique anymore but it still works wonders for brands that are looking to become ‘instantly recognizable’. It works on the logic that you are riding off of the trust, reach, and relationship of already established accounts to grow your own brand faster.
#7 The ‘ConvertKit’ Sales Funnel
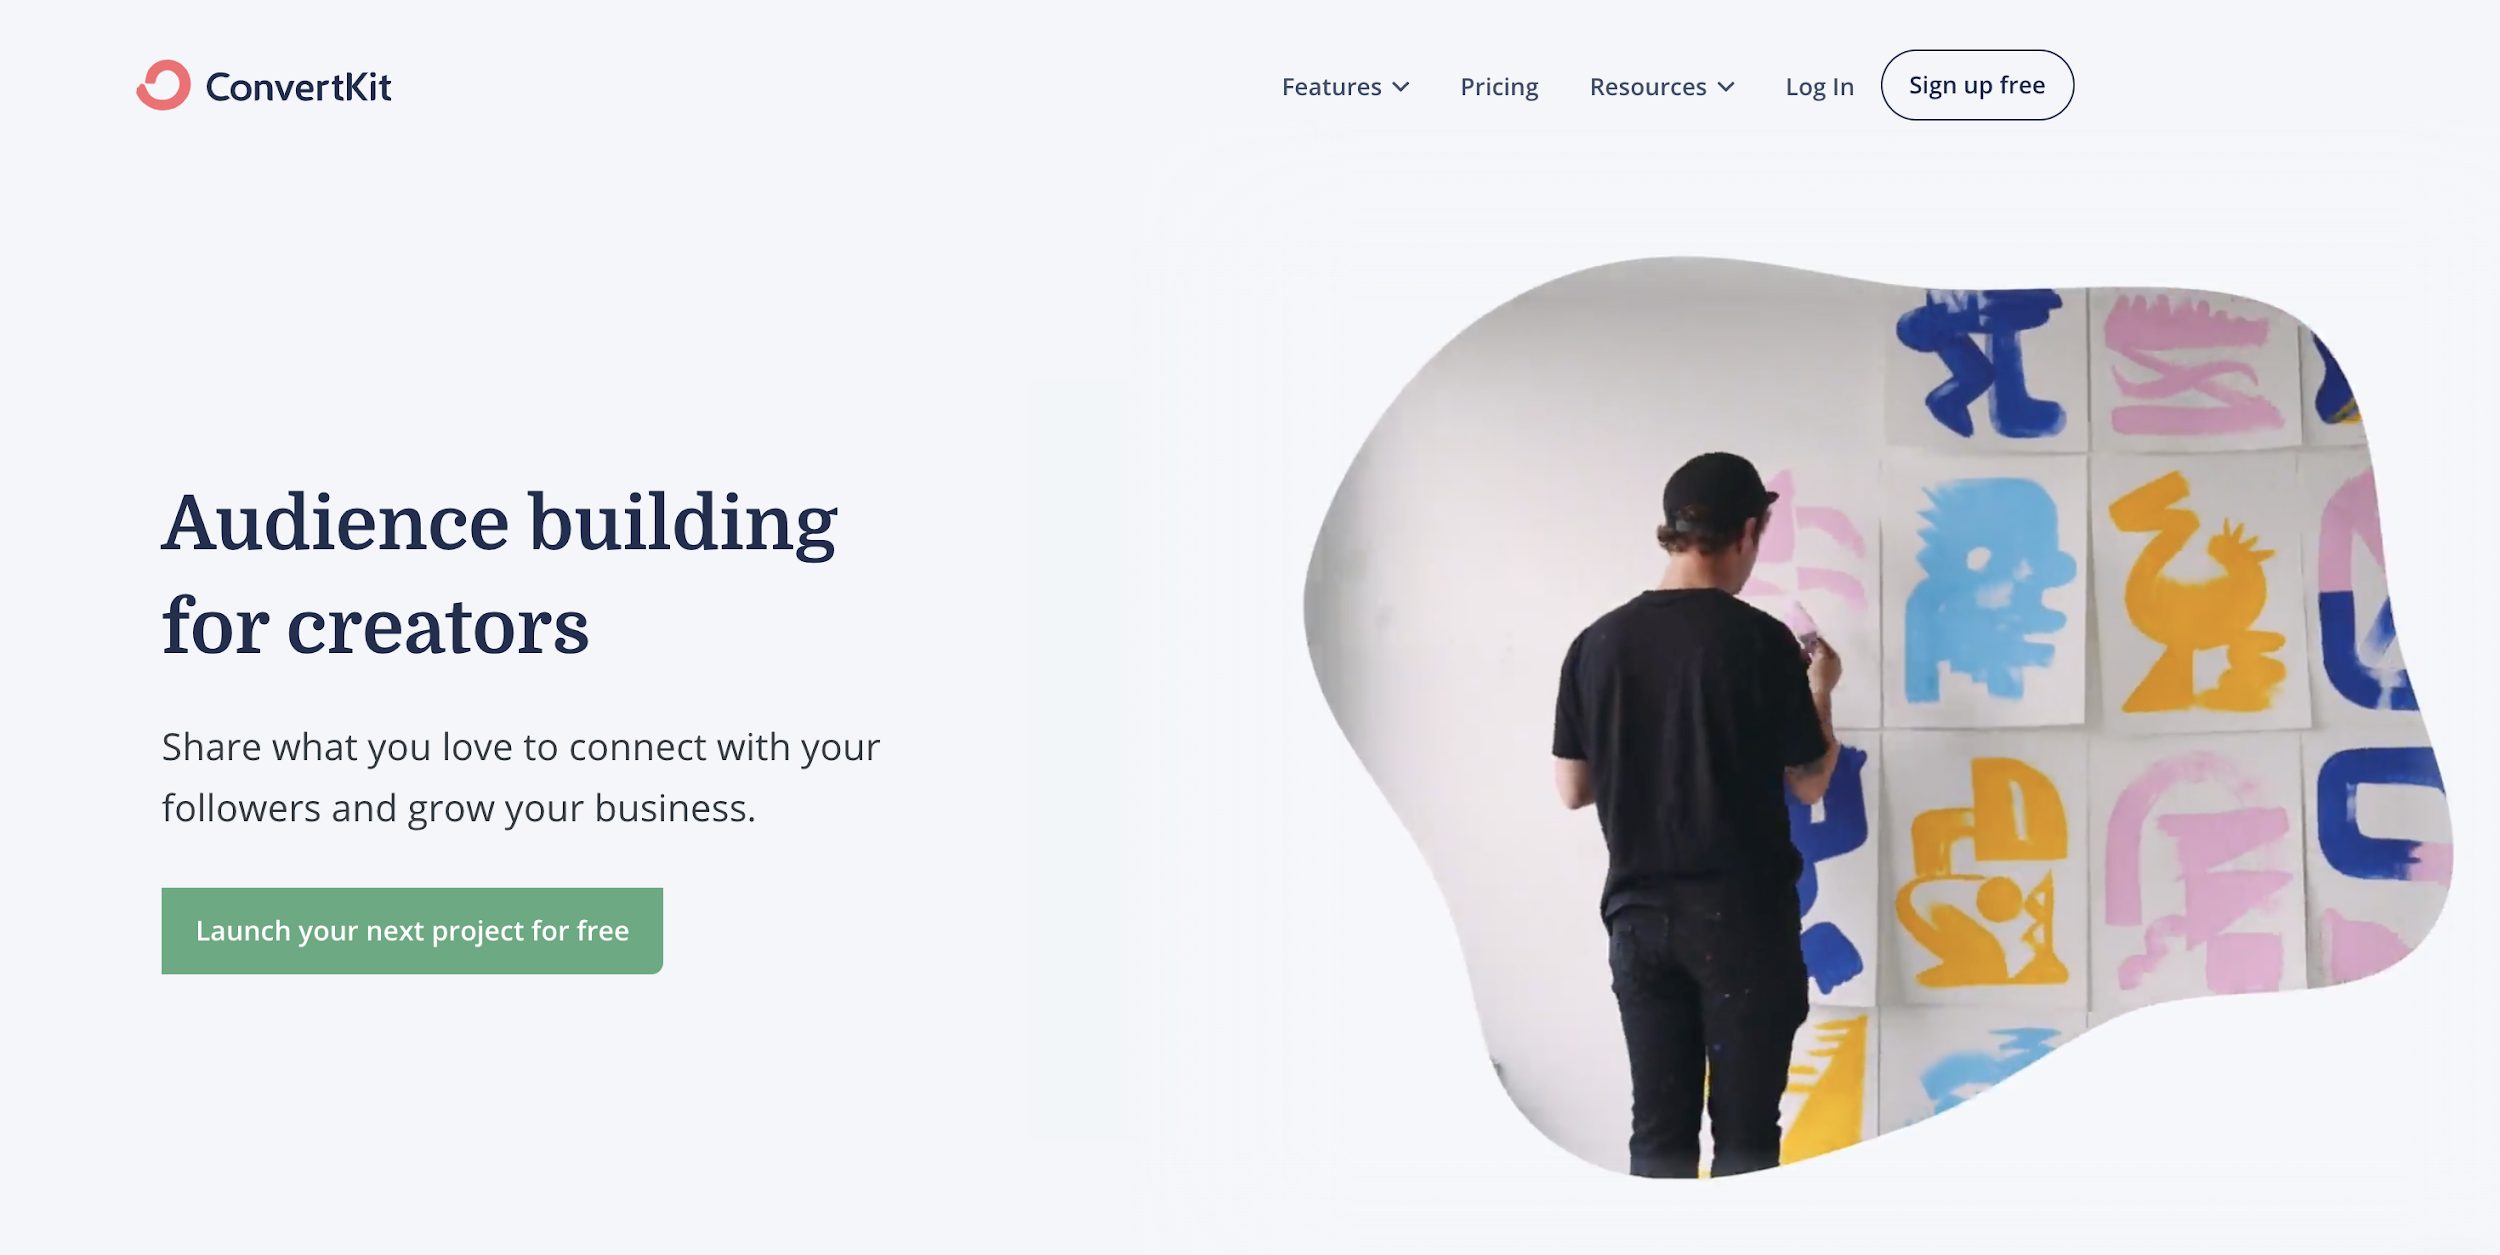
Type of sales funnel: ‘Partner Webinar’ Funnel
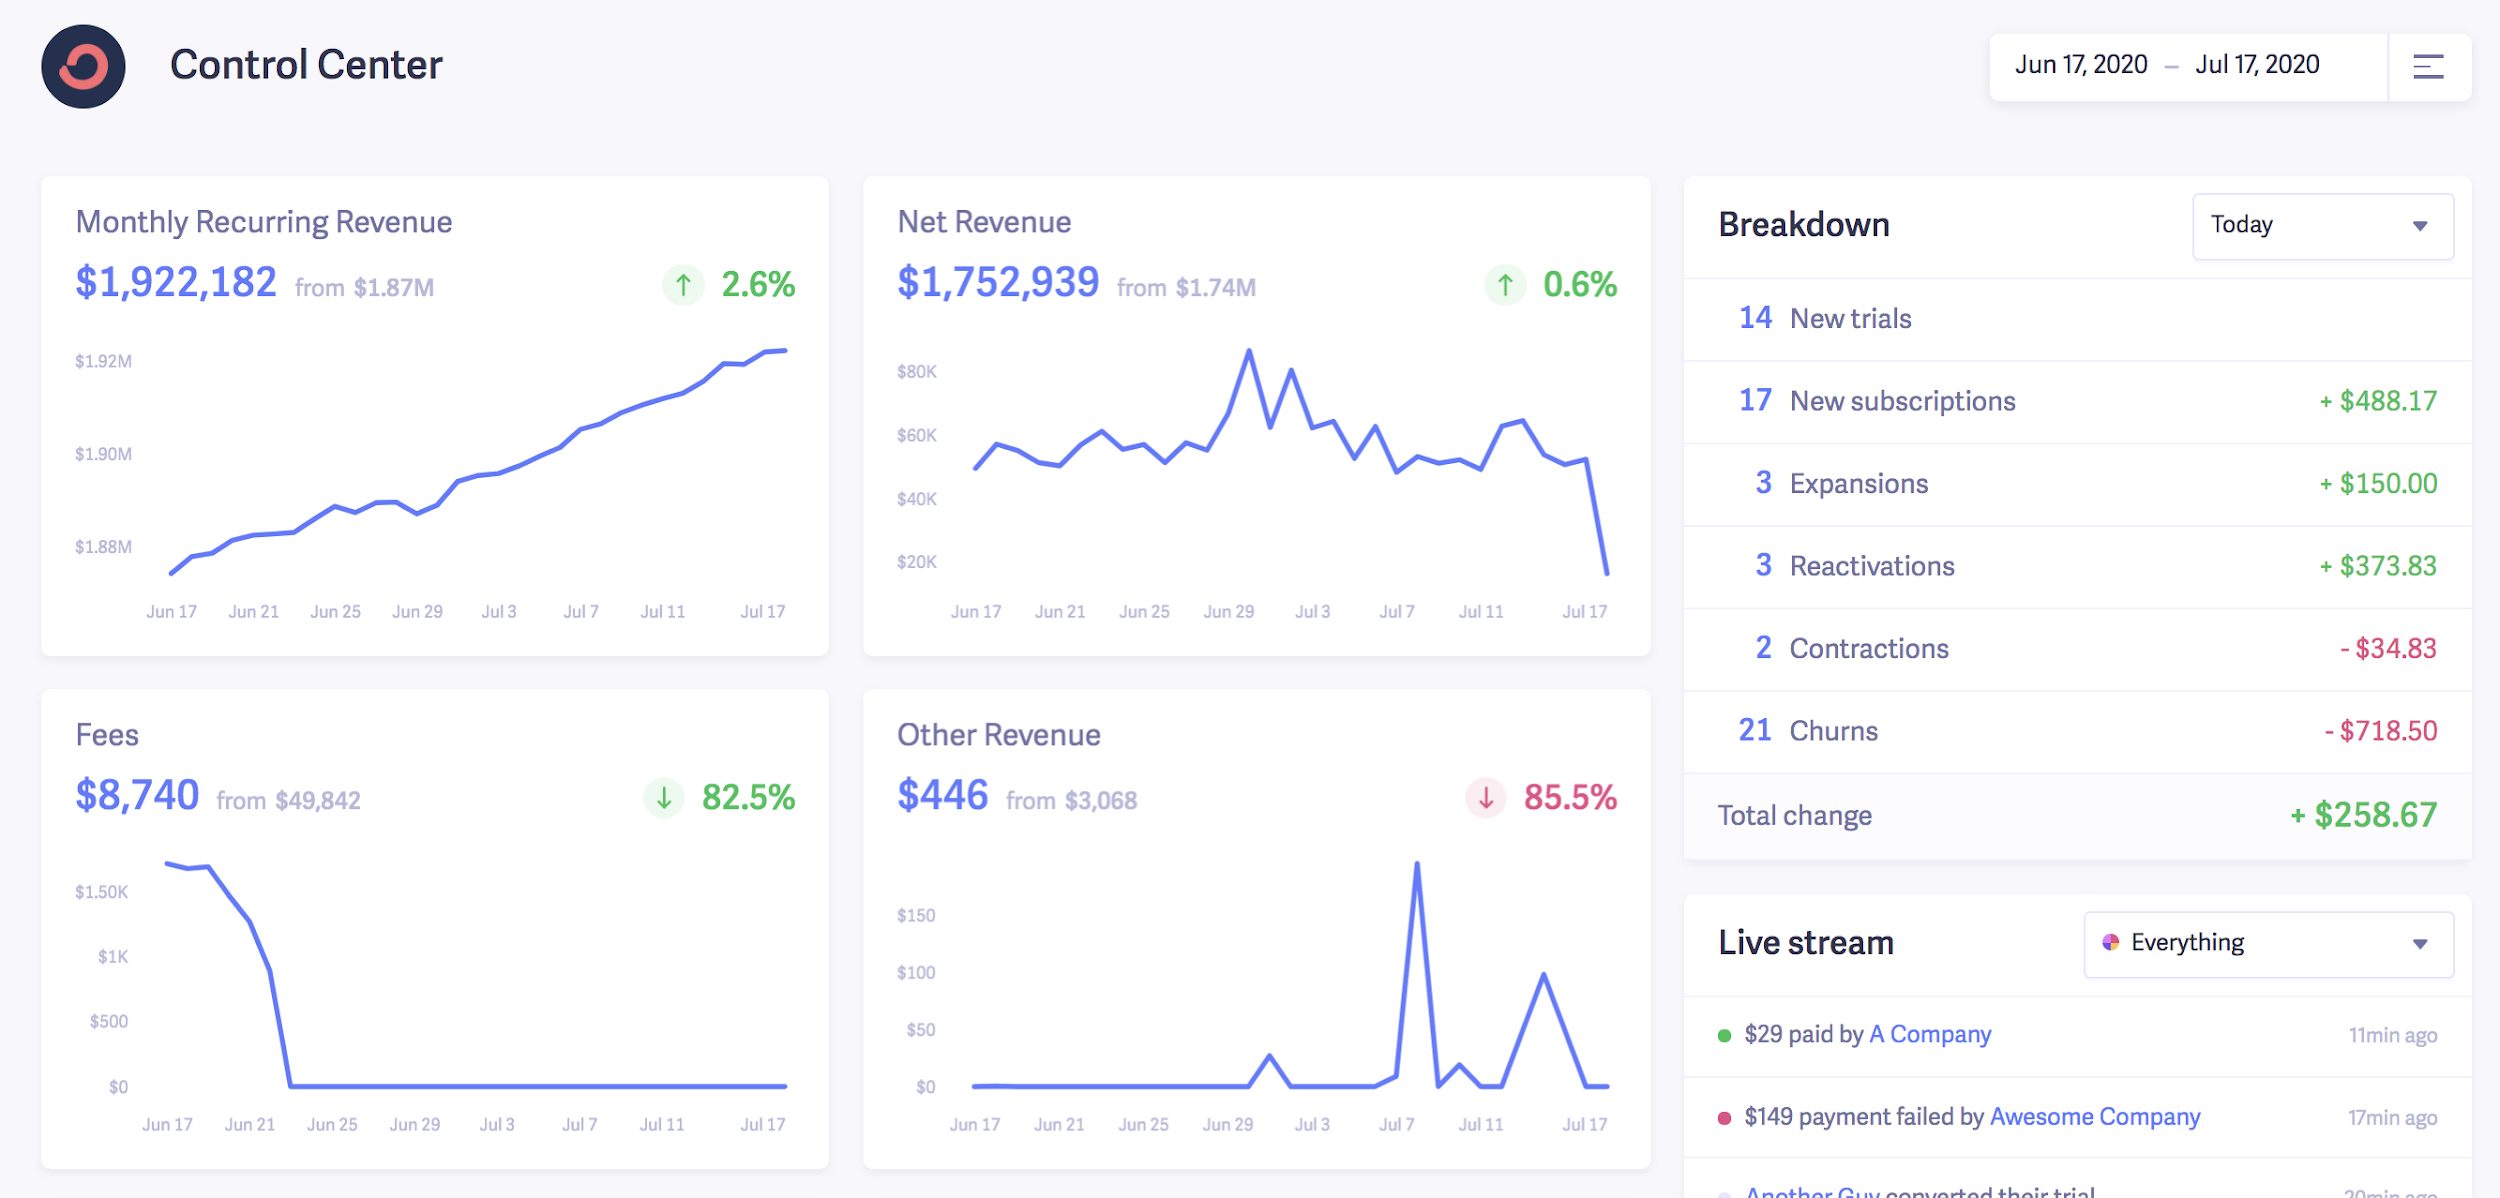
ConvertKit was generating about $70k to $80k in monthly revenue before Nathan Berry, the founder, and Darrell Vesterfelt decided they needed to find a way to grow their audience.
So far they had been getting most of their traffic through bloggers that knew about them or affiliates that were promoting their product. Nathan decided to take this idea up a notch with partner webinars which grew ConvertKit to nearly 2 million in Monthly Recurring Revenue.
Darrell joined the team and set out to grow ConvertKit with this marketing strategy. Webinars were low-cost and resulted in signups every single time. He knew that 73% of B2B marketing experts believe that a webinar has the highest lead generation success rate.
They kept presenting webinars that talked about their product over and over again with different partners- mainly affiliate bloggers. This is what resulted in ConvertKit growing from $98k to $625k in monthly revenue.
What does this sales funnel look like?
ConvertKit focused on maintaining their affiliate program and keeping it open to whoever wanted to join, providing a referral code to enhance the joining process. No matter what the new affiliate’s follower count was, the team behind ConvertKit would reach out to them and ask them if they wanted to host a webinar.
The webinar would always result in a few signups coming in if not hundreds or thousands.
The key was to make sure that they were giving people that tuned in value through the webinar instead of just begging them to buy their product.
They included free courses, free trials, and free stuff so that no matter what, anyone who tuned in left loving ConvertKit.
Why use this funnel?
This sales funnel works particularly well for brands that are targeting a narrow market. ConvertKit was targeting just bloggers who needed email marketing software which is why this low-cost marketing strategy did so well so fast.
They had the right connections and the right community of people were tuning in to watch the webinar.
What makes it unique?
This funnel is one of the few that focuses on keeping things as simple as possible. You do not need fancy technology or loads of money to invest, you just need a narrow audience to target and a good webinar.
Hosting partner webinars is still a relatively new strategy with not many people focusing on it but for new companies that want to grow their reach and capture leads, it may be exactly what they are looking for.
[BONUS] #8 The ‘Kurzgesagt – In a Nutshell’ Sales Funnel
Type of sales funnel: ‘YouTube’ Funnel
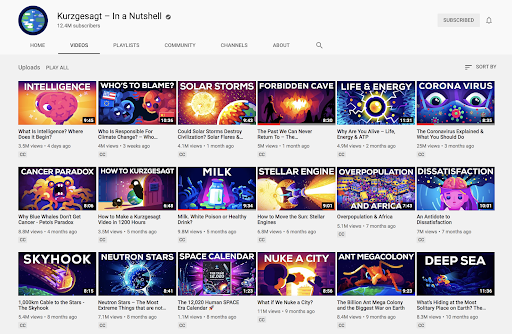
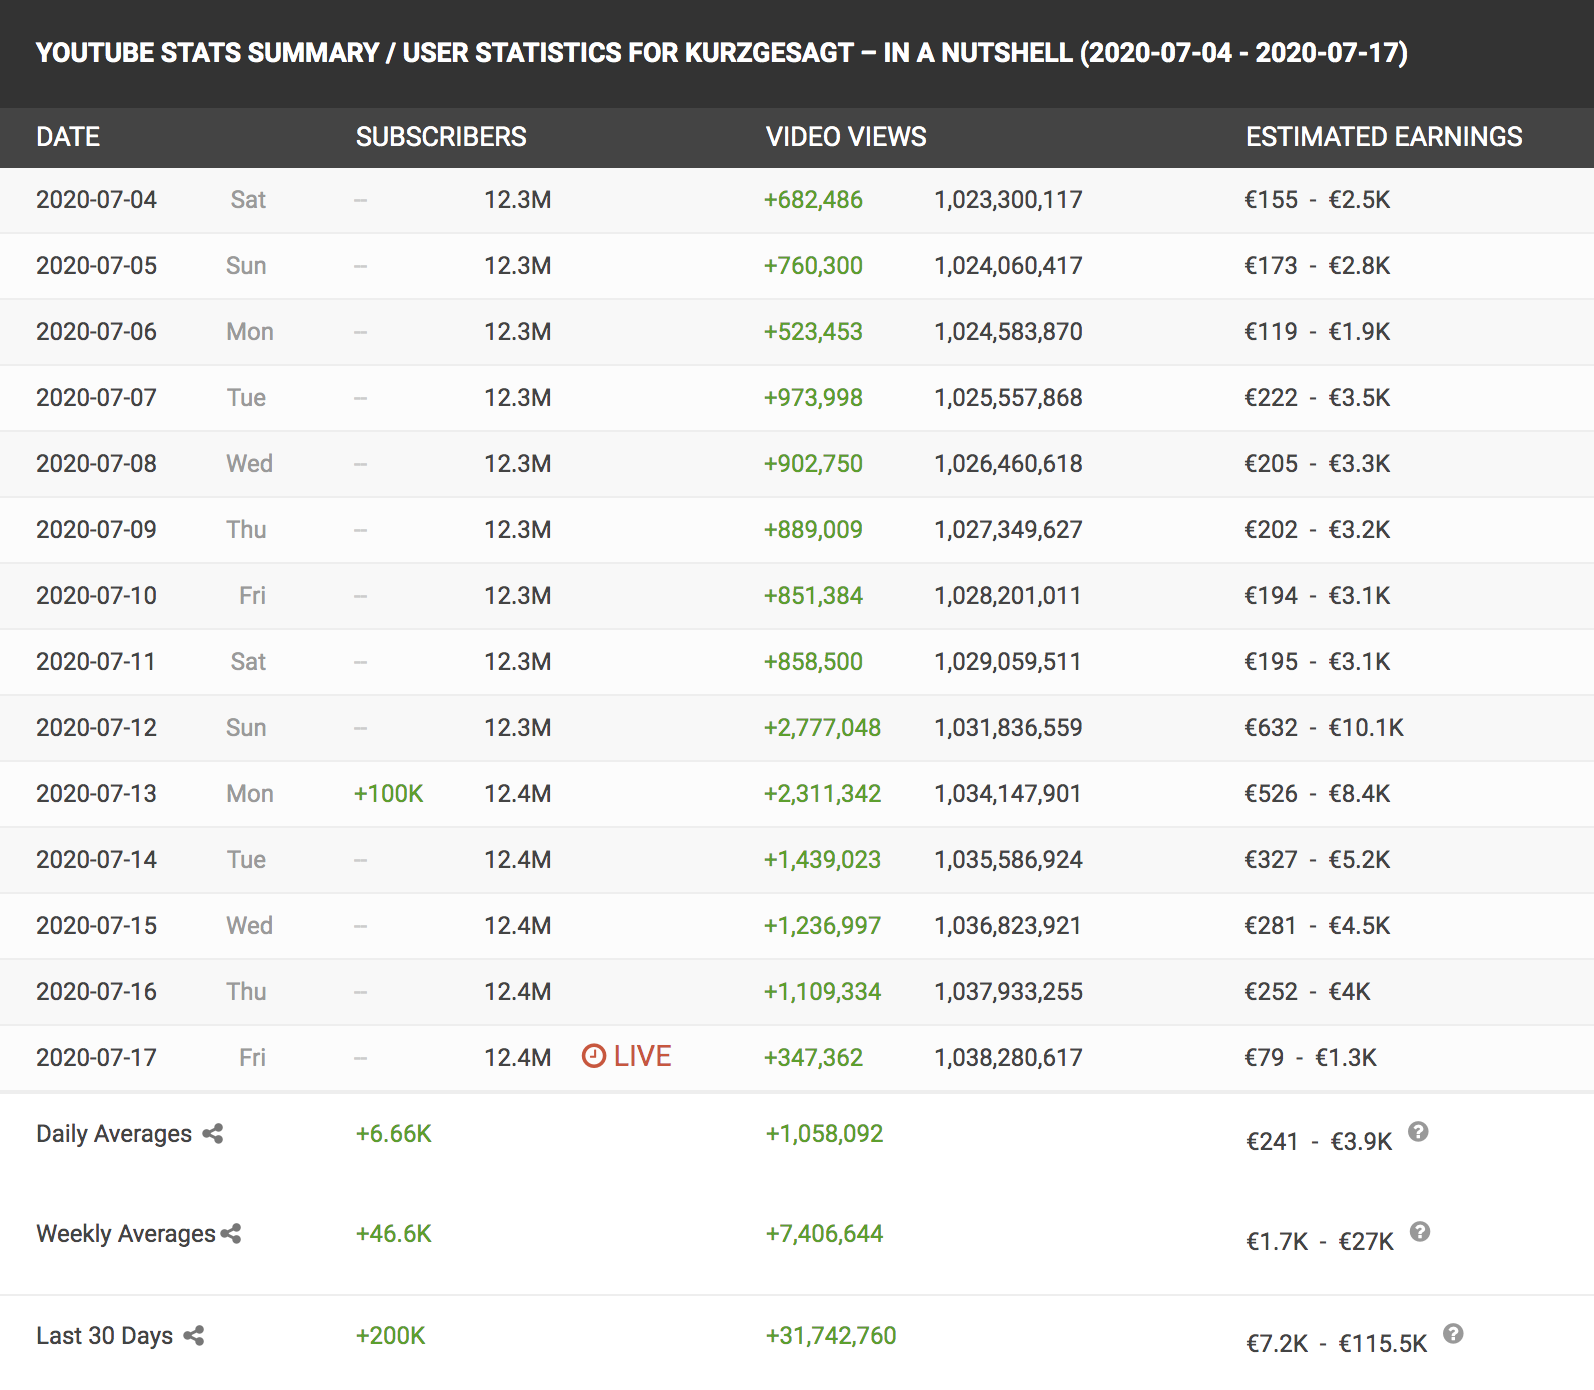
Kurzgesagt – In a Nutshell produces high-quality, unique and amazingly designed 2D animation videos covering a wide variety of topics. They have 12.4M subscribers and every single video gets between 4M – 25M views. This means they average 31M+ views every 30 days and gain 200k+ subscribers every month.
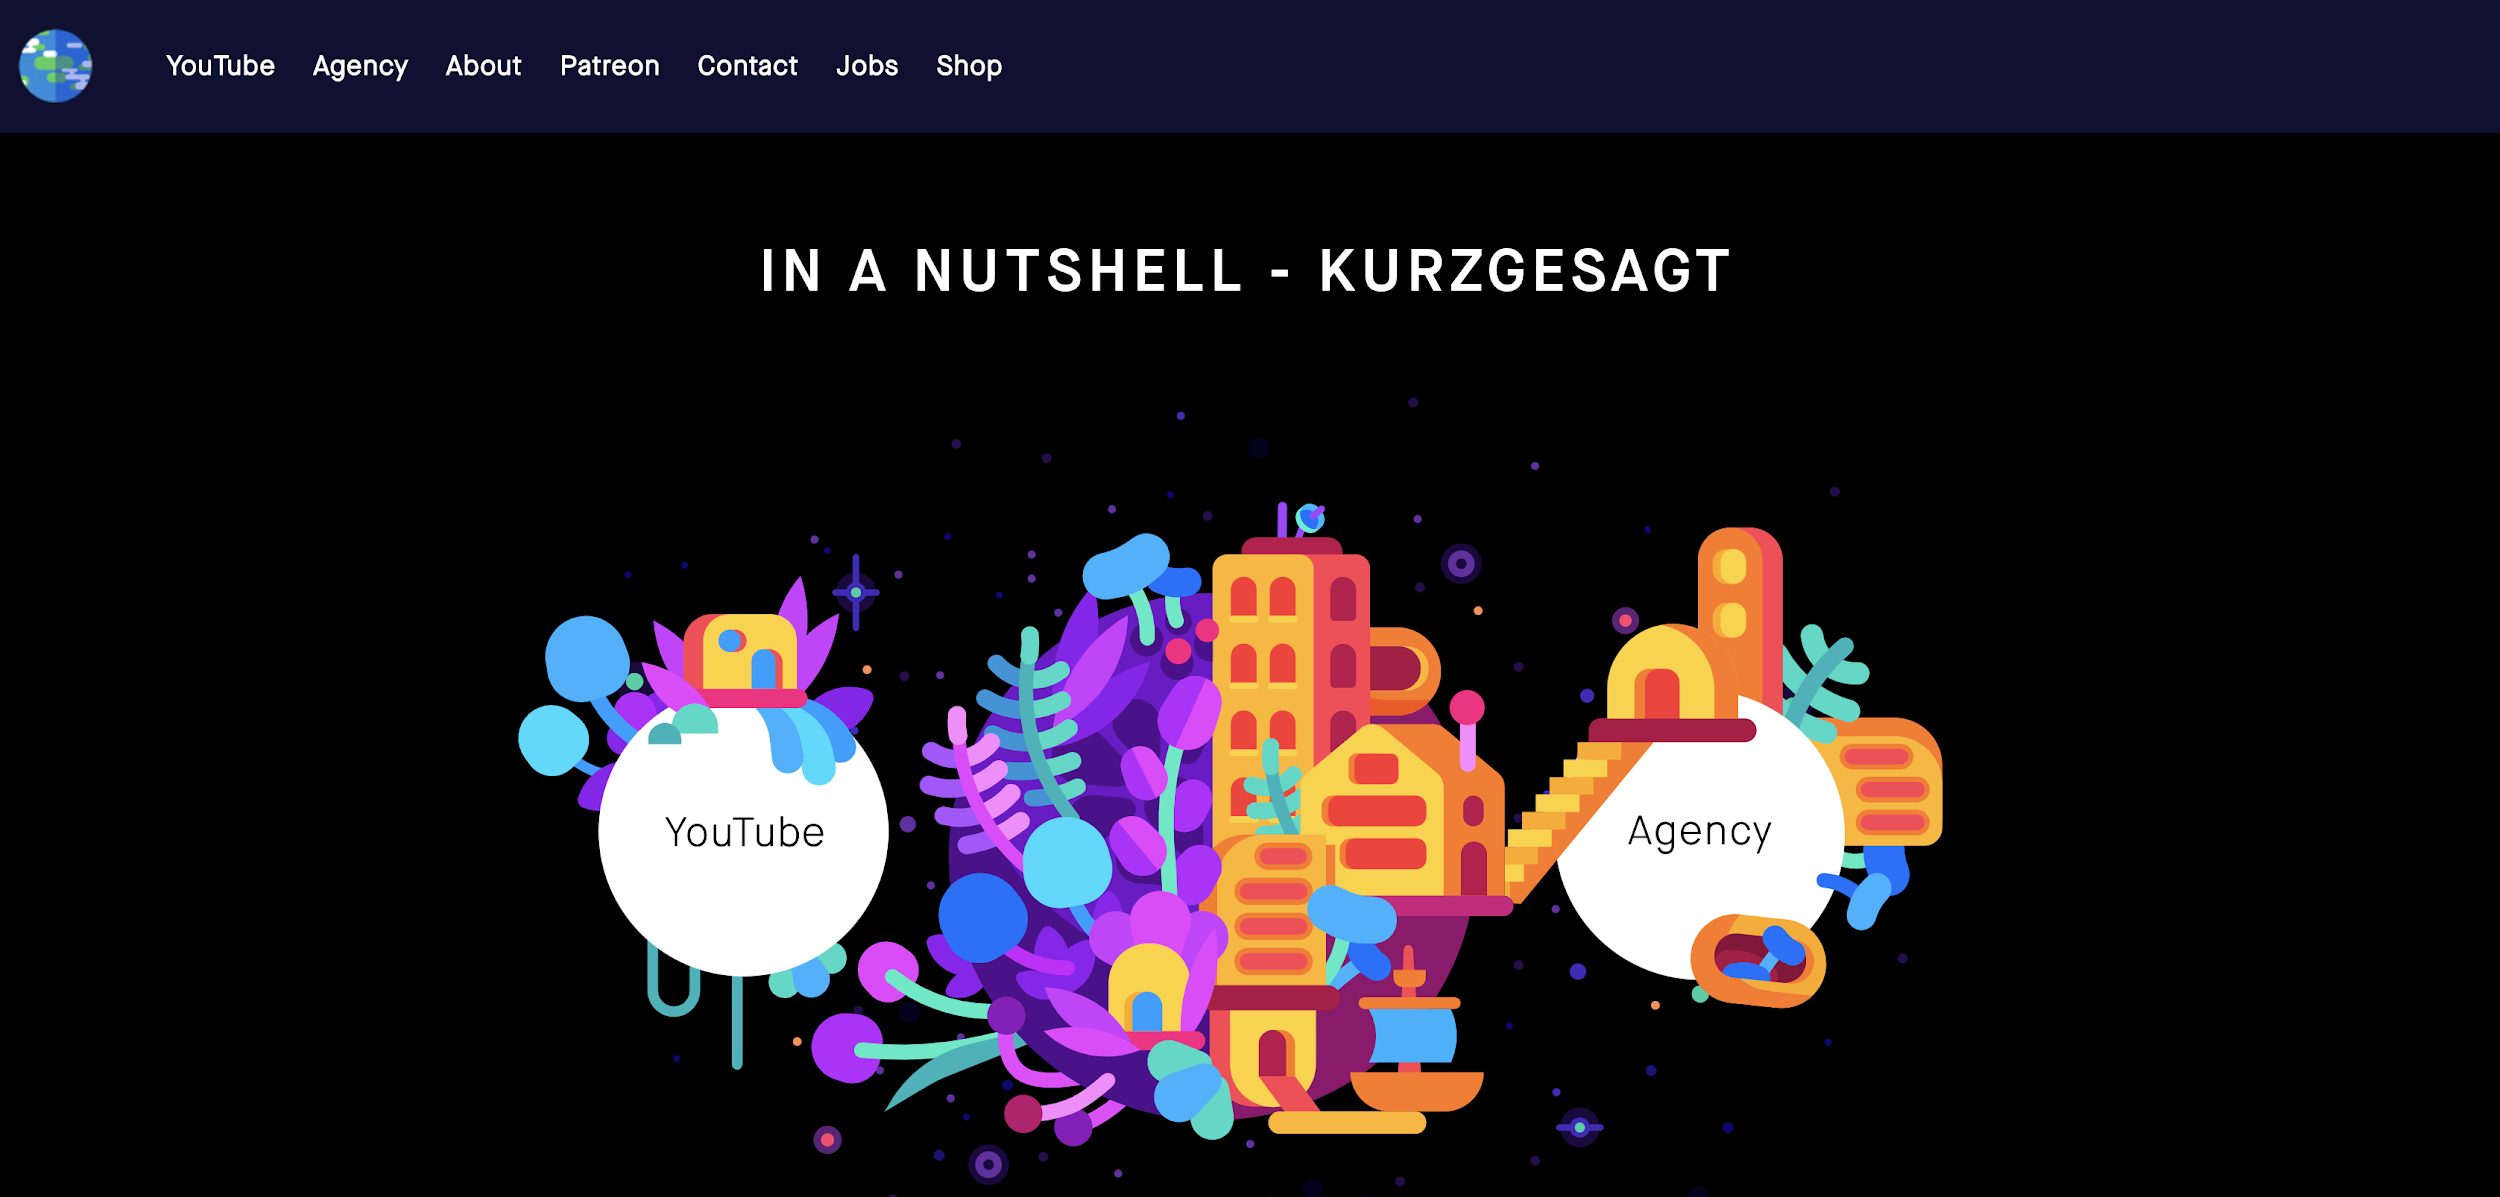
There is a good chance you have already heard of them but do you know that they are also a digital marketing agency?
(Source)
The idea is that they use the interest garnered from their YouTube videos to bring in customers for their digital marketing agency. All they need is good animation maker software, intro-making tools and dedication to making catchy and viral videos
The sales funnel works on the logic that the ‘proof is in the pudding’.
It is like saying- ‘Look at how many views we bring in on our own channel with our amazingly talented team. Wouldn’t you want us to do the same for you?’
What does this sales funnel look like?
This sales funnel is pretty straight forward. It brings in leads by showcasing what they do every single day on their own YouTube channel.
Even if you are not interested in hiring a digital marketing agency, it is very likely that you have thought to yourself ‘Wow, that video was created beautifully’.
Now imagine if you were. Wouldn’t you look into who was creating the videos that bring in millions of views?
Why use this funnel?
This funnel is perfect for people that are trying to sell a digital service or product. They can showcase what their service is capable of every single day by incorporating it into their own business.
If you think about it, OptinMonster does this as well by using their software to bring in new email subscribers and leads.
What makes it unique?
This is one of the few sales funnels that are not at all obvious and yet one of the most effective. Not many companies realize the benefits of showing people what their service is capable of. If you use it for your own work everyday, that builds far more trust than simply begging someone else to try it.
Conclusion
Sales funnels allow you to create long-lasting relationships with your leads and grow your brand as a whole. According to MarketingBlender, 73% of consumers say they feel frustrated when websites show them ads that are not related to them.
A sales funnel allows you to only target the right customers for your product. Instead of simply adding non targeted ads to websites, you will get to focus on leads that are already invested in you as a brand.
So, which sales funnel is your favorite?